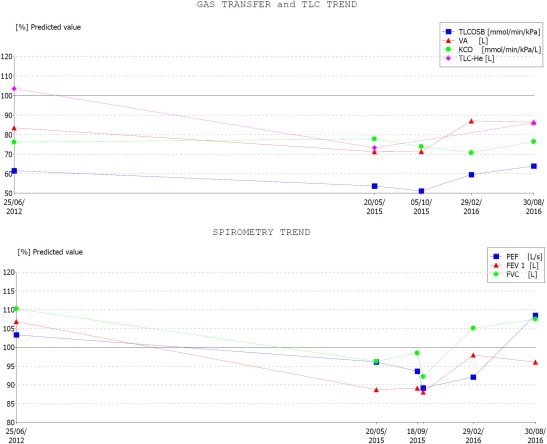
Figure 2.

Lung function pre‐ and post‐rituximab and mycophenolate treatment. Changes in lung function as a percentage of predicted are demonstrated over time. Initially there is a reduction in lung volume [forced vital capacity (FVC), total lung capacity (TLC)], airflow [forced expiratory volume in 1 s (FEV1) and peak expiratory flow (PEF)] and gas transfer [total lung capacity for carbon monoxide (TLCO)] from 2012 to 2015. Following initiation of treatment (end 2015) there has been an improvement in these measurements. [Colour figure can be viewed at wileyonlinelibrary.com.]
