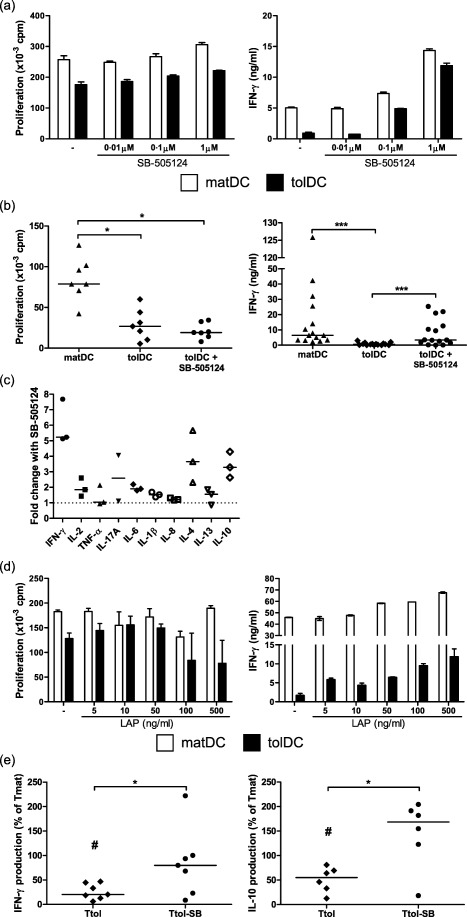
Figure 2.

Transforming growth factor (TGF)‐β1 diminishes the ability of tolerogenic dendritic cells (tolDC) to stimulate healthy control (HC) T cells and is involved in their regulatory function. (a–d) Mature lipopolysaccharide (LPS)‐activated dendritic cells (matDC) or tolDC (1 × 10⁴ cells/well) were co‐cultured with allogeneic HC CD4+ T cells (1 × 10⁵ cells/well) in the absence or presence of increasing concentrations of SB‐505124, a small molecule inhibitor of TGF‐βRI (a) or 1 μM SB‐505124 (b,c) or increasing concentrations of recombinant latency‐associated peptide (LAP) (d). Proliferation (a,b,d, left panels), measured using [3H]‐thymidine uptake, and interferon (IFN)‐γ production (a,b,d, right panels), measured using enzyme‐linked immunosorbent assay (ELISA), were assessed at day 6. (c) Additional cytokines were detected in day 6 culture supernatants from tolDC‐CD4+ T‐cell cultures using an ELISA [interleukin (IL)−17A] or Meso Scale Discovery (MSD) immunoassay (all others). The fold change in cytokine production following inhibition of TGF‐β1 signalling was calculated by: concentration of cytokine produced in the presence of 1μM SB‐505124 ÷ concentration of cytokine produced in the absence of 1 μM SB‐505124. IL‐17A was undetectable in one experiment. Error bars in (a) and (d) represent standard error of the mean (s.e.m.) of triplicates (proliferation) or duplicates (IFN‐γ production). Horizontal lines in (b) and (c) represent median values, (b) left panel (proliferation) n = 7; (b) right panel (IFN‐γ production) n = 15; (c) (cytokines) n = 3. (e) Allogeneic healthy control (HC) CD4+ T cells were primed with DC (10 : 1) for 6 days and rested for 4 days with 10 IU/ml IL‐2. T cell lines primed by matDC (Tmat), tolDC (Ttol) and tolDC + SB‐505124 (Ttol‐SB) were restimulated with matDC and IFN‐γ (left panel) and IL‐10 (right panel) production, measured using ELISA, was assessed on day 3. Results are depicted as the percentage cytokine production of Tmat cell lines. Cytokine concentrations range: IFN‐γ in Ttol = 0.9–20·6 ng/ml and in Ttol‐SB = 4·4–80·7 ng/ml; IL‐10 in Ttol = 0·4–5·1 ng/ml and in Ttol‐SB = 0·9–31·7 ng/ml. Horizontal lines represent median values, n (IFN‐γ production) = 7; n (IL‐10 production) = 6. *P < 0·05 and ***P < 0·0001 calculated with Wilcoxon signed‐rank test. #Significant differences (P < 0·05) between Ttol and Tmat cells.
