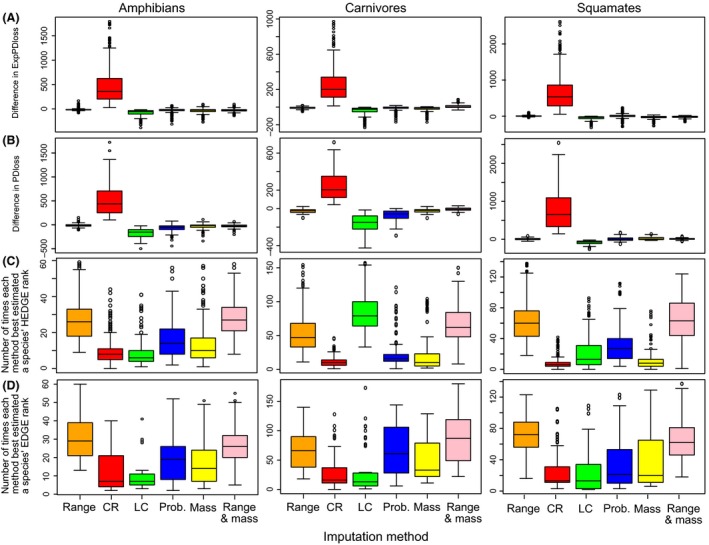
Figure 2.

Efficiency of imputation methods to reduce bias in (A) ExpPDloss, (B) PDloss, (C) HEDGE, (D) EDGE. The first two rows of the graphics represent the difference (y‐axis) in (A) ExpPDloss and (B) PDloss between true values and values obtained after simulating and then imputing DD status using each of imputation method (x‐axis). The last two rows represent the number of species (y‐axis) for which an imputation method (x‐axis) led, compared to the other imputation methods, to the smallest difference between their true (C) HEDGE or (D) EDGE rank and the rank obtained after simulating and imputing DD status. Body mass (yellow and pink bars) was used for carnivores and body size for amphibians and squamates.
