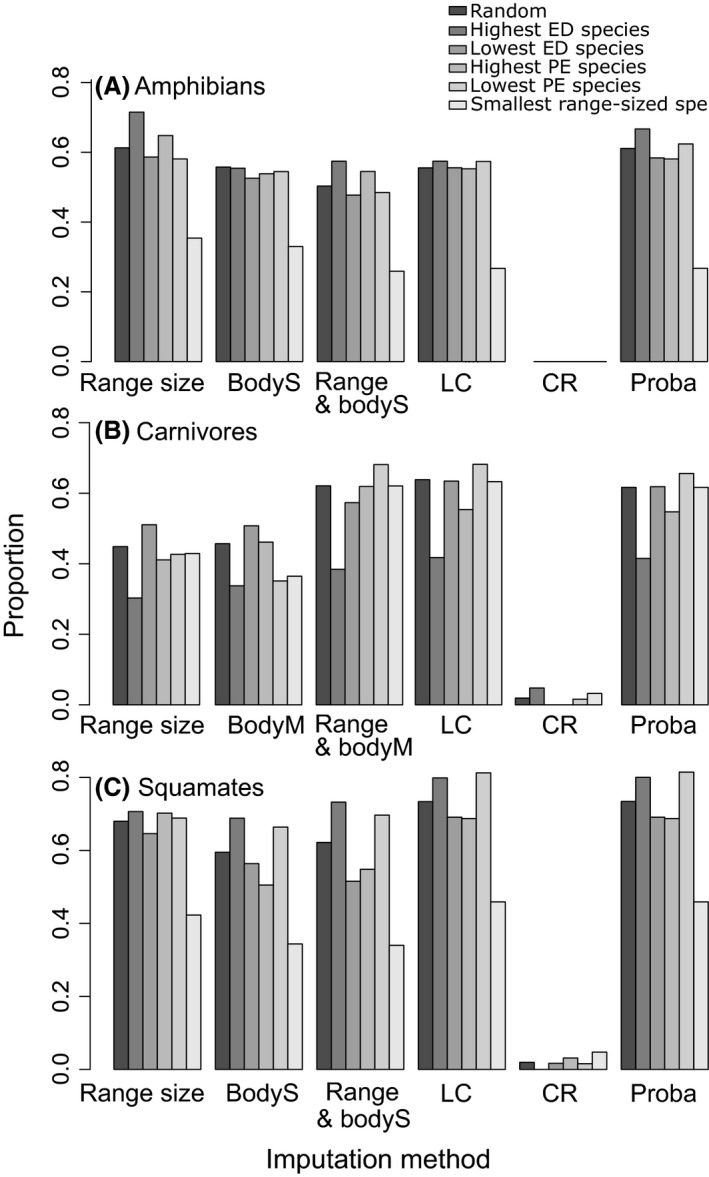
Figure 3.

Proportion of correct threat status imputation: (A) amphibians, (B) carnivores, (C) squamates. The graphics represent the frequency (y‐axis) to which each imputation method (x‐axis) correctly replaced threat status of simulated DD species. Different clustering of simulated DD species was tested (represented by different colors of the histogram bars). Body mass (BodyM) was used for carnivores and body size (BodyS) for amphibians and squamates.
