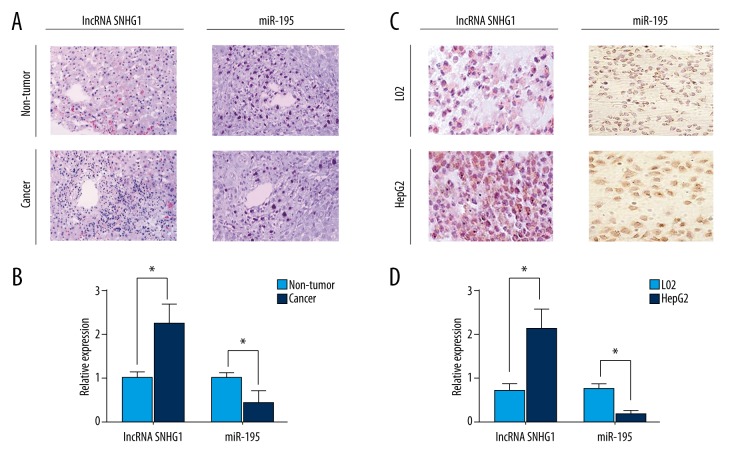
Figure 1.
lncRNA SNHG1 exhibited high expression levels in both HCC tissues and HepG2 cell lines. (A) lncRNA SNHG1 and miR-195 expression was detected in HCC tissues and matched non-tumor tissues from HCC patients using hybridization in situ. (B) RT-PCR was used to measure lncRNA SNHG1 and miR-195 expression in HCC tissues and matched non-tumor tissues. (C) Relative expression levels of lncRNA and miR-195 were detected in HepG2 and L02 cells using hybridization in situ. (D) RT-PCR was used to measure lncRNA SNHG1 and miR-195 expression in HepG2 and L02 cells. lncRNA SNHG1 and miR-195 data were presented in the form of mean ± standard deviation (n=3). Similar results were obtained from three independent experiments. (* p<0.05).

