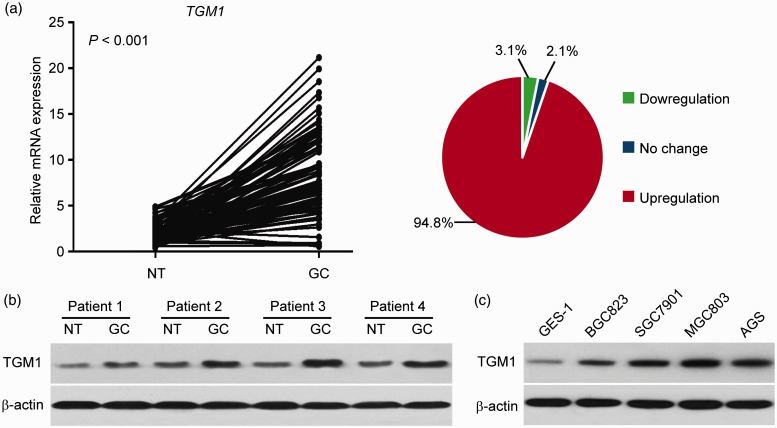
Figure 1.
TGM1 is upregulated in gastric cancer. (a) Expression levels of TGM1 as determined by qRT-PCR in gastric cancer tissues (GC) and compared with matched adjacent normal gastric tissues (NT) from the same patient (P < 0.001). (b) Protein levels of TGM1 as determined by Western blot analysis in GC and matched NT from four randomly selected patient samples. (c) Protein levels of TGM1 as determined by Western blot analysis in one human normal gastric epithelial cell line (GES-1) and four gastric cancer cell lines (BGC823, SGC7901, MGC803 and AGS). (A color version of this figure is available in the online journal.)

