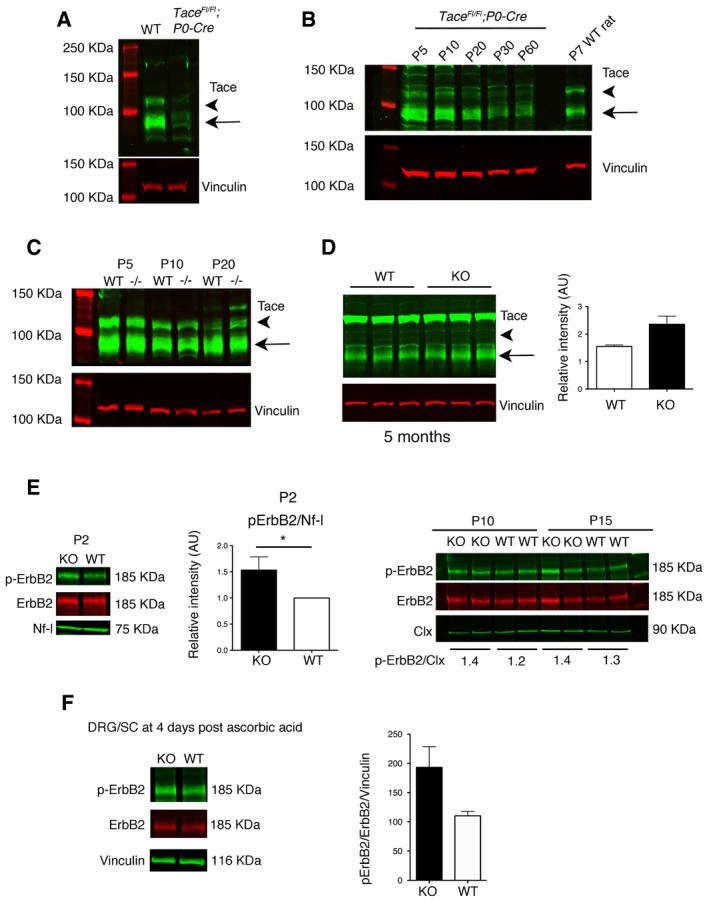
Western blot analysis of Tace using lysates from WT and Tace
Fl/Fl;P0‐Cre mouse sciatic nerves at P10 (65 μg of total protein lysate loaded). Representative of two independent experiments.
Western blot analysis (50 μg of total protein lysate loaded) shows that Tace expression in axons is maximal at P5‐P10 and then progressively declines in the adult. Representative of two independent experiments.
Western blot analysis of Tace in Mtmr2
−/− sciatic nerves at P5, P10, and P20. Representative of two independent experiments.
Western blot analysis of Tace using lysates from Mtmr2
−/− mouse sciatic nerves at 5 months, with quantification, P = 0.10, two‐tailed Mann–Whitney U‐test. Representative of two independent experiments.
Phosphorylation of ErbB2 in Mtmr2
−/− sciatic nerves at P2, P10, and P15. At P2, each lane is a pool of n = 7 animals per genotype, representative of six independent experiments using n = 6 different nerve pools per genotype, and quantification using WT values arbitrary set to 1. *P = 0.0313, Wilcoxon rank‐sum test. At P10 and P15, mean values of two samples are shown. At P10, each lane is a pool of n = 3/4 animals per genotype, representative of three independent experiments using n = 6 different pools per genotype. Nf‐l, neurofilament light chain; Clx, calnexin.
Phosphorylation of ErbB2 in Mtmr2
−/− Schwann cell/DRG neuron co‐cultures after 4 days of ascorbic acid treatment. Each lane is a pool from at least 10 coverslips/DRG per genotype. Representative of two independent experiments using n = 4 different pools of coverslips/DRG per genotype, P = 0.20, two‐tailed Mann–Whitney U‐test.
Data information: Results in (D–F) are expressed as mean ± SEM. In (A–D), arrowheads indicate the pro‐protein and arrows show the cleaved active form of Tace.