
Figure EV1. Schematic representation of genome‐wide LOD score calculations.
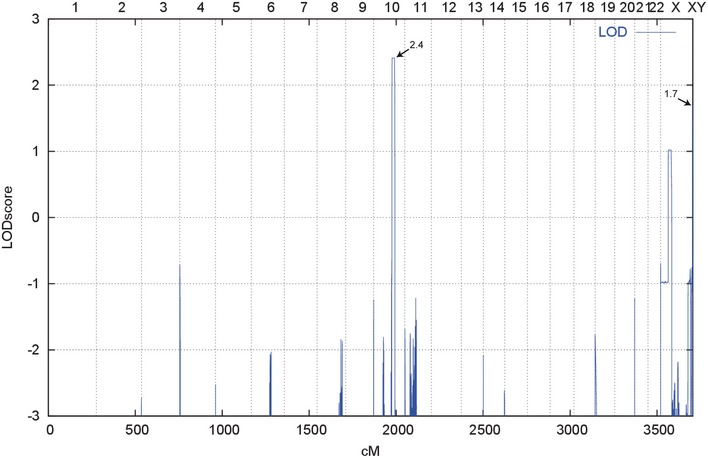
LOD scores calculated with ALLEGRO are given along the y‐axis relative to genomic position cM (centiMorgan) on the x‐axis. Note the highest peak (LOD score 2.4) in the region on chromosome 10 and a second lower peak in the XY PAR1 (LOD score 1.7).