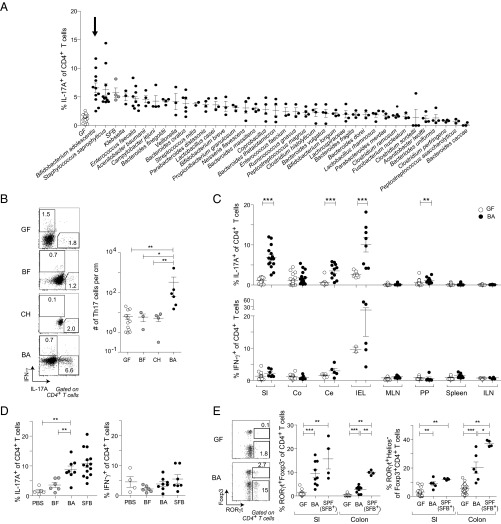
Fig. 1.
B. adolescentis (BA) induces a robust intestinal Th17 population. (A) Frequency of SI-LP Th17 cells in GF mice monocolonized with individual symbiont bacteria as described in Materials and Methods. White and gray symbols represent GF and SFB-monocolonized mice, respectively. Arrow indicates BA-monocolonized mice. (B) Inflammatory cytokine production by SI-LP CD4+ T cells in mice colonized as indicated. (Left) Representative flow cytometric dot plot. (Right) Summary data. (C) Frequencies of (Upper) Th17 and (Lower) Th1 cells in various tissues of mice colonized as indicated. (D) Frequencies of (Left) Th17 and (Right) Th1 cells in the SI-LP of SPF mice gavaged as described in Materials and Methods with the indicated microbes. SFB+ SPF mice were bred at Harvard Medical School and naturally colonized with SFB. (E) Induction of intestinal RORγt expressers. (Left) Representative flow cytometric dot plot of SI-LP CD4+ T cells; summary data for frequencies of (Center) RORγt+ Foxp3− cells and (Right) RORγt+ Helios− Treg cells. Numbers in B and E refer to the fractions of cells in the identical gates. (B–E) Mean ± SEM pooled from two to four independent experiments. BF, B. fragilis; Ce, cecum; CH, C. histolyticum; Co, colon; IEL, intraepithelial lymphocyte layer; ILN, inguinal lymph node; MLN, mesenteric lymph nodes; PP, Peyer’s patches; SI, small intestine. *P < 0.05 (Mann–Whitney u test); **P < 0.01 (Mann–Whitney u test); ***P < 0.001 (Mann–Whitney u test).

