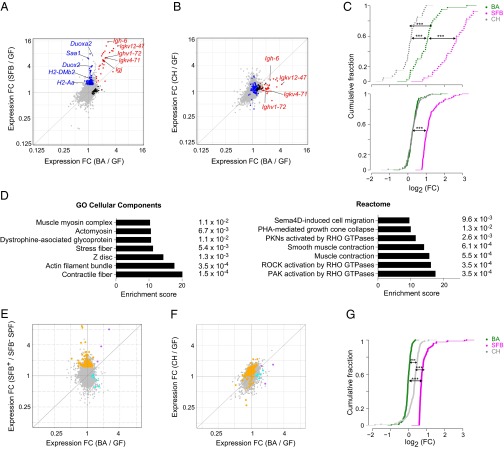
Fig. 5.
B. adolescentis (BA) and SFB both induce B-cell transcripts, but otherwise, they trigger distinct transcriptional programs. (A and B) Whole-tissue transcriptomes. Fold change (FC)/FC plots comparing ileum tissue transcripts induced by (A) BA vs. SFB (Th17 inducing) or (B) BA vs. C. histolyticum (CH; Th17 noninducing). In A, blue indicates genes up-regulated primarily by SFB, black indicates genes up-regulated primarily by BA, and red indicates genes up-regulated by both bacteria. Certain transcripts previously associated with SFB-mediated induction of Th17 cells or encoding Igs are indicated. In B, the genes highlighted in A are again highlighted in the same colors. (C) Statistics for A and B. FC distribution of (Upper) SFB-induced Ig or (Lower) non-Ig RNAs in the ileal transcriptomes of mice colonized as indicated. Only transcripts increased by SFB by at least ≥1.6-fold with a P value of <0.05 were plotted. ***P < 0.001 (Kolmogorov–Smirnov test). (D) Pathways (from the two databases as indicated) enriched in transcripts specifically up-regulated in the ileum by BA relative to GF mice were determined using Enrichr. P values are indicated to the right. (E and F) S-IEC transcriptomes. As per A and B, except that transcripts from isolated S-IECs were examined. In E, orange indicates genes up-regulated primarily by SFB, cyan indicates genes up-regulated primarily by BA, and purple indicates genes up-regulated by both bacteria. In F, the genes highlighted in E are again highlighted in the same colors. (G) Statistics for E and F. Calculated as per C. n = 3 (A–D) or 2–4 (E and F) per group. ***P < 0.001.

