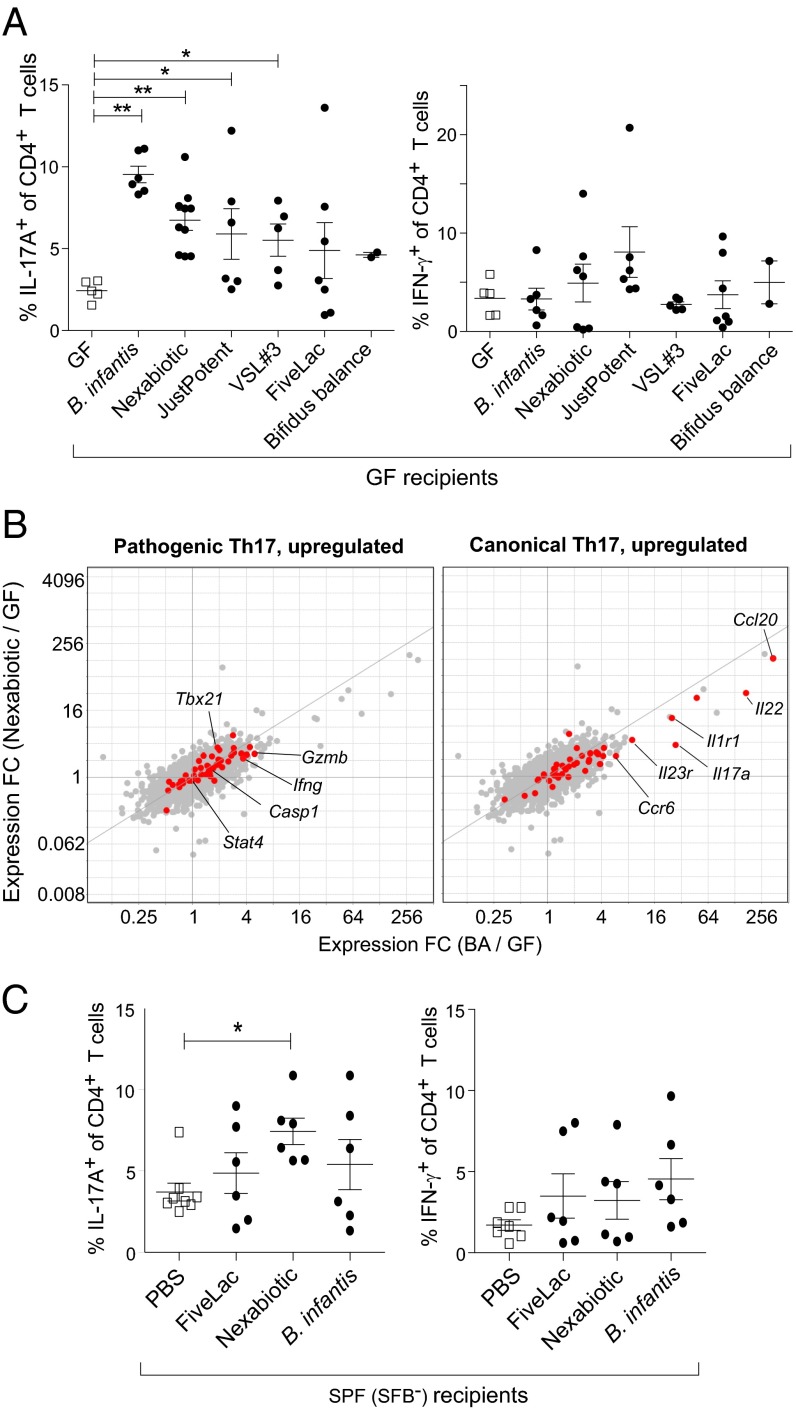
Fig. 7.
Some probiotic formulations containing bifidobacterial species also elicit Th17 populations in the SI-LP. (A) Frequencies of SI-LP (Left) Th17 or (Right) Th1 cells in GF mice colonized with the indicated probiotic mixes. (B) Th17 cell phenotype. Fold change (FC)/FC plots comparing transcripts induced by B. adolescentis (BA) vs. the probiotic mix, Nexabiotic, in SI-LP CD4+ T cells. Symbols in red and labels are as per Fig. 2G (n = 2–3 per group). (C) Frequencies of SI-LP (Left) Th17 and (Right) Th1 cells in SPF (SFB−) mice gavaged with PBS or one of three other probiotic preparations in A. Full names and corresponding abbreviations of probiotics can be found in SI Materials and Methods. Each symbol represents one mouse. Data are pooled from two to three independent experiments. Mean ± SEM. *P < 0.05 (Mann–Whitney u test); **P < 0.01 (Mann–Whitney u test).

