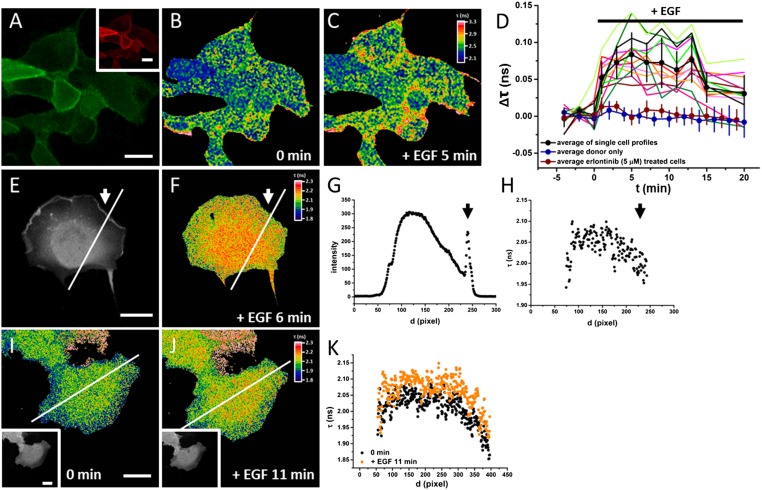
Fig. 6.
Imaging of K-Ras activity in cells. (A–C) Confocal mCitrine (A) TF4 (A, Inset) and FLIM images of serum-starved MDCK cells microinjected with mCitrine–K-RasE31C–TF4–CVIM before (B) and 5 min after (C) EGF stimulation. (D) Quantification of fluorescence lifetime change in cells. Colored lines represent individual cell measurements, and the black line with error bars represents mean ± SD (n = 13 cells). Blue and red lines with error bars represent control measurements of donor only (mean ± SD; n = 14 cells) and in the presence of Erlotinib (mean ± SD; n = 14 cells), respectively (two-tailed t test). *P < 0.05; **P < 0.01. (E and F) Intensity (E) and FLIM image (F) of EGFP–K-RasD30C–TF3–CVIM after EGF stimulation in serum-starved COS-7 cells. Arrows indicate membrane ruffling. (G and H) Profiles of fluorescence intensity (G) and fluorescence lifetime (H) along the indicated line in E and F. (I and J) FLIM image of EGFP–K-RasD30C–TF3–CVIM in serum-starved COS-7 cells before (I) and 11 min after (J) EGF stimulation. (K) Quantification of the fluorescence lifetime along the line shown in I and J. Black and orange profiles indicate before and after EGF stimulation, respectively.

