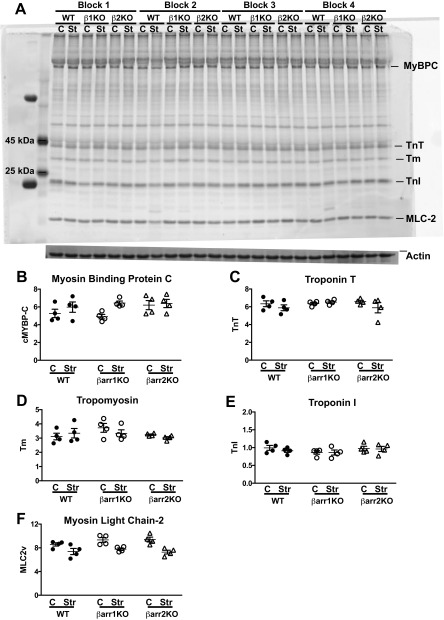
Fig. S6.
Myofilament phosphoprotein survey of ex vivo stretch left ventricles. (A) Representative phosphoprotein gel image of ex vivo stretch left ventricles. β1KO, β-arrestin 1 KO; β2KO, β-arrestin 2 KO; C, control; Str, ex vivo stretch. (B) Average phosphorylated myosin-binding protein (MyBPC). (C) Average phosphorylated troponin T (TnT). (D) Average phosphorylated tropomyosin (Tm). (E) Average phosphorylated troponin I (TnI). (F) Average phosphorylated myosin light chain 2 (MLC-2). n = 4 separate left ventricles per genotype and condition (control and stretch). Statistical comparisons are made using one-way ANOVA with Bonferroni’s multiple comparison test. No significant differences were noted between the WT and KO mice. Error bars reflect SEM.

