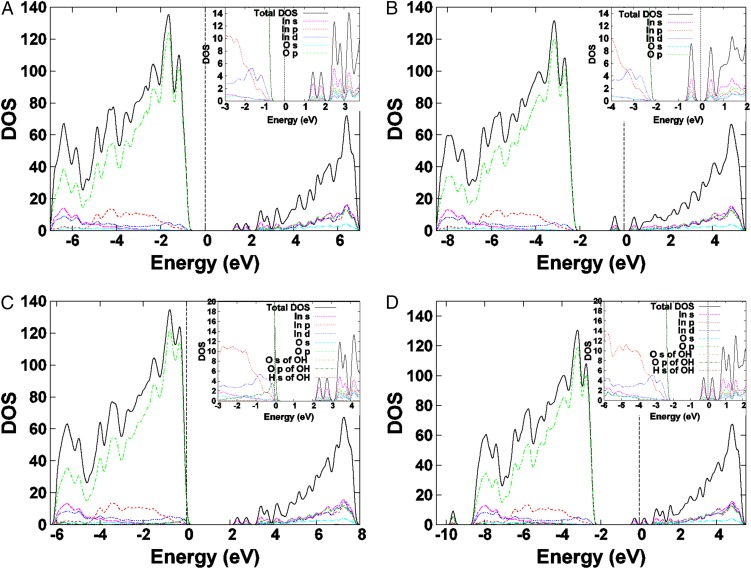
Fig. 6.
Effect of Ov and OH defects on the total and PDOS for various indium oxide (111) surfaces. (A) Pristine, defect-free In2O3 surface. (B) In2O3-x surface containing only an oxygen vacancy (Ov) defect. (C) In2O3(OH)y surface containing only an OH defect. (D) In2O3-x(OH)y surface containing both Ov and OH defects. The zero-energy value is set at the Fermi level, represented by the vertical dashed line. (Insets) An expanded view of the states at the band edges.

