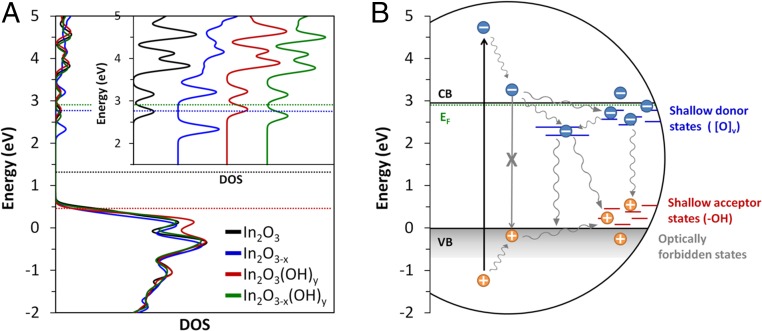
Fig. 7.
Comparison between calculated total DOS for pristine and defected (111) indium oxide surfaces and a schematic diagram illustrating the different charge carrier relaxation processes in In2O3-x(OH)y. Both diagrams are plotted on the same energy scale and aligned using the Fermi level of the In2O3-x(OH)y surface and the experimentally measured Fermi level of I-250. (A) The total DOS for (111) In2O3, In2O3-x, In2O3(OH)y, and the In2O3-x(OH)y surfaces. The horizontal dashed lines indicate the position of the Fermi level for each surface. (Inset) Expanded view of the DOS in the conduction band region. (B) A schematic illustration of charge carrier recombination pathways in In2O3-x(OH)y nanoparticles. The vertical black arrow indicates initial excitation from the pump pulse. The wavy gray arrows illustrate different nonradiative relaxation processes. Blue and red lines indicate midgap states created by oxygen vacancy and surface hydroxyl groups, respectively.

