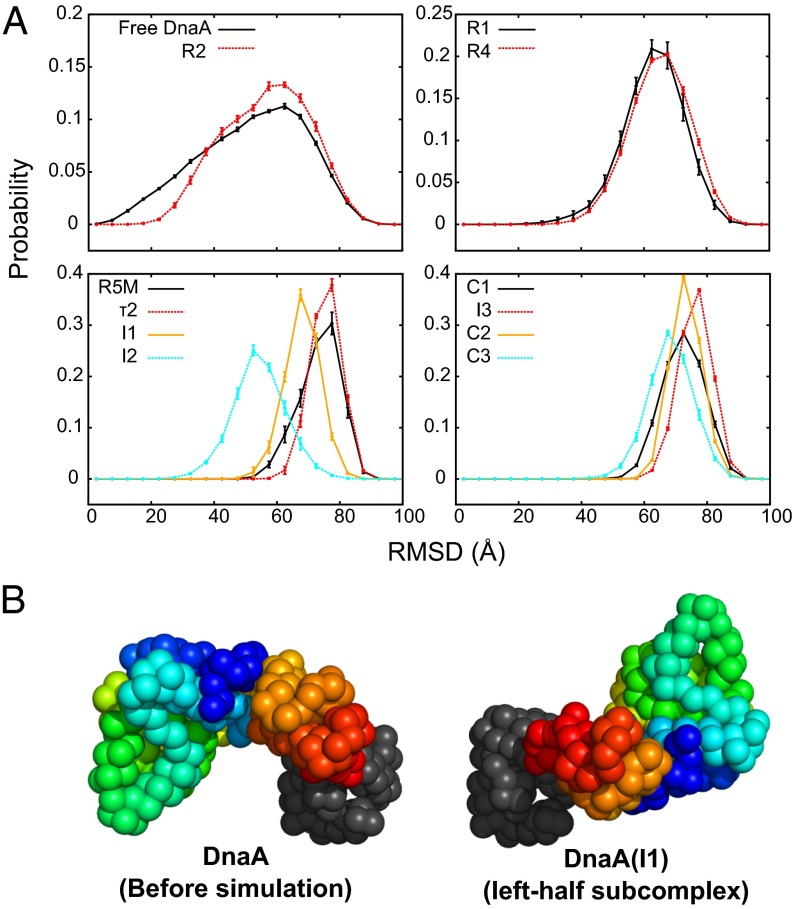
Fig. 5.
Analysis of the simulated complex structures. (A) An analysis of the conformational change in each DnaA molecule in the complete complex. The distributions of the rmsd of individual DnaA domain III from the reference DnaA structure are plotted. The rmsd is calculated after domain IV is superimposed. Error bars express sample SD of trajectories. (B) Representative conformations of DnaA before and after formation of the pentameric complex (I1 box as an example). Domain IV (gray) is spatially aligned for all images. Domain III is rainbow colored from blue (K135) to red (L373).

