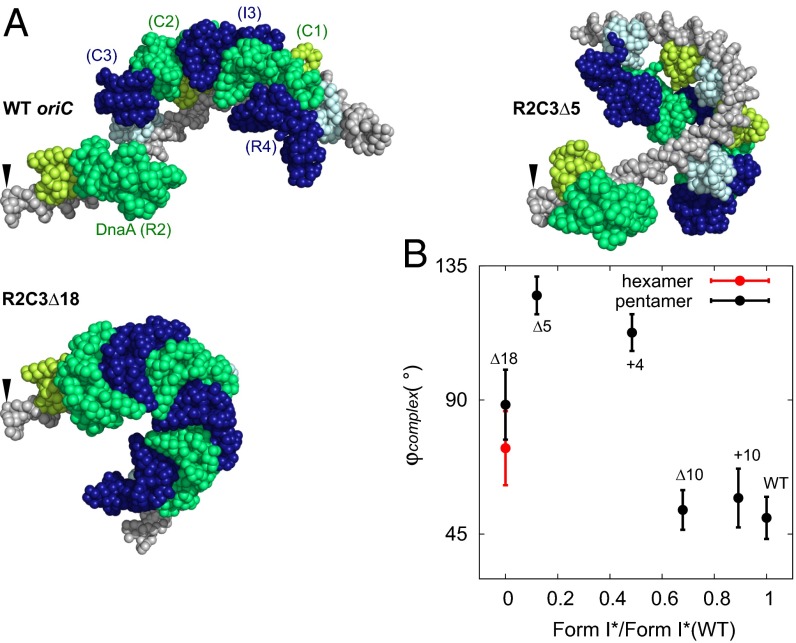
Fig. 8.
Computational modeling of deletion/insertion mutants of oriC. (A) Representative complex models obtained for WT oriC and mutant sequences. For R2C3Δ5, we chose a pentameric oligomer model. For R2C3Δ18, we chose a hexameric model. The models are spatially aligned by the Left end (shown by the arrow). The color scheme is identical to Fig. 2. (B) The correlation plot between the experimental form I* values from 24-nM DnaA condition normalized by that of WT (horizontal axis) and the mean angle φcomplex of DnaA oligomer in simulated models (vertical axis). Here, φcomplex represents the mean tilt of each complex relative to WT (SI Appendix, SI Methods). Error bars express sample SD of nine individual experiments.

