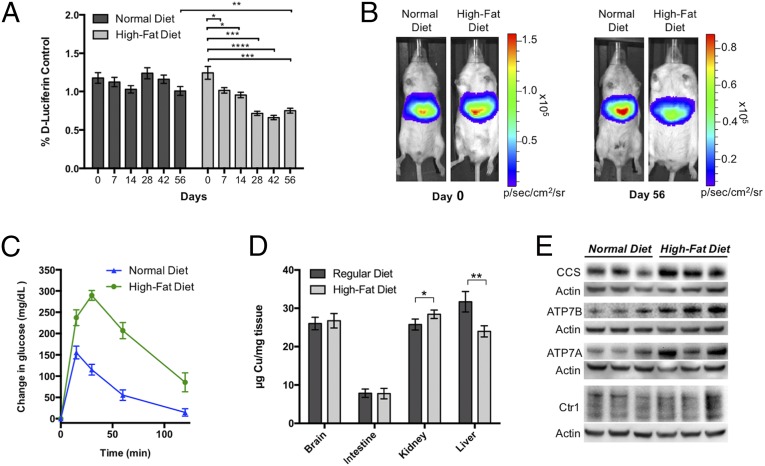
Fig. 5.
CCL-1 imaging reveals hepatic copper deficiency in a diet-induced murine model of NAFLD. (A) Bioluminescent signal from CCL-1 (normalized to d-luciferin) of L-Luc mice placed on HFD or normal feeding conditions. Mice were imaged biweekly after i.p. injection of d-luciferin followed by CCL-1 2 d later. Error bars are ±SEM (n ≥ 9), and statistical analyses were performed with a two-tailed Student’s t test where *P ≤ 0.05, **P ≤ 0.01, ***P ≤ 0.001, and ****P ≤ 0.0001. (B) Representative images of mice from HFD and normal diet groups before the study (day 0) and at the end of the 8-wk feeding period (day 56). (C) Glucose clearance test to monitor glucose intolerance of the two groups of mice following i.p. injection of 200 mg/dL of glucose. Glucose was injected after blood glucose levels were measured at time = 0 min. Data are expressed as changes in glucose levels from basal levels (levels measured at time = 0 min, before glucose injection). Error bars are ±SEM (n = 6). (D) ICP-MS analysis of total copper in brain, intestine, kidney, and liver tissues from HFD and normal diet groups. Error bars are ±SEM (n = 6 or 7), and statistical analyses were performed with a two-tailed Student’s t test where *P ≤ 0.05 and **P ≤ 0.01. (E) SDS/PAGE analysis of liver extracts of three mice fed normal diets and three HFD mice. Tissues were probed for CCS, ATP7B, ATP7A, and Ctr1. For Ctr1, the region comprising the unglycosylated (25 kDa) and glycosylated monomer (33–37 kDa) are shown (full blot shown in SI Appendix, Fig. S15).

