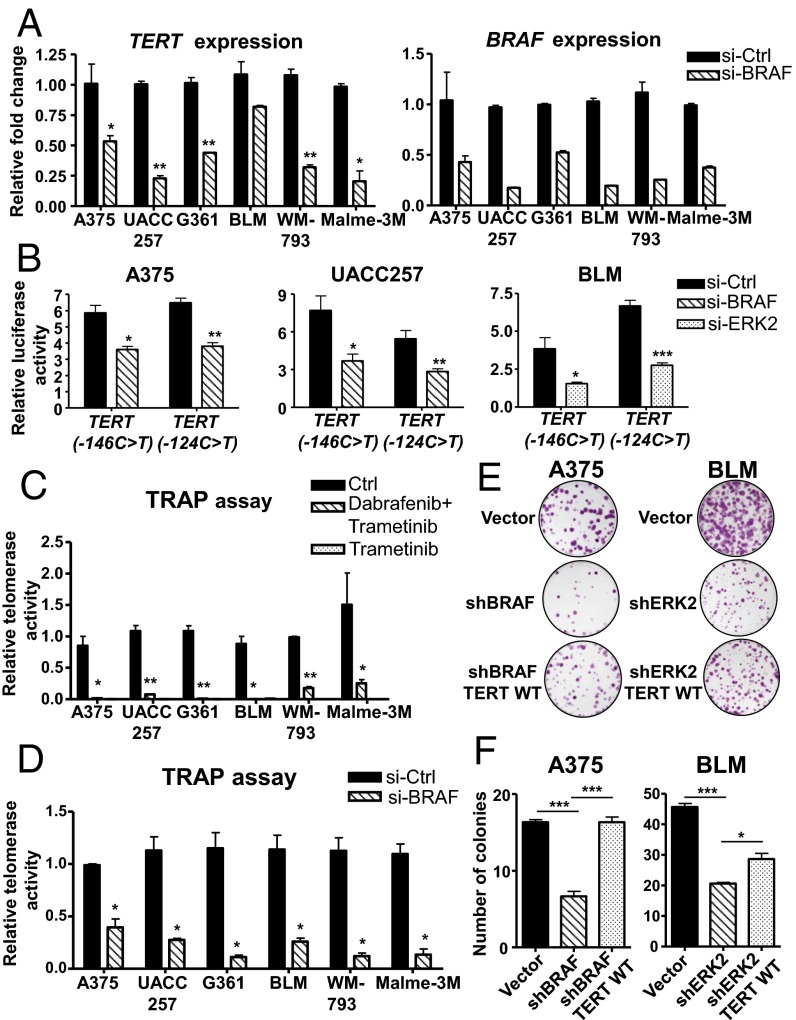
Fig. 2.
Inhibition of RAS-ERK signaling reduces the telomerase activity and proliferation of BRAF/NRAS-mutant melanoma cells carrying TERT promoter mutations. (A) A375, UACC257, G361, BLM, WM793, and Malme-3M cells were treated with si-Control (Ctrl) or si-BRAF and analyzed for TERT and BRAF expression after 3 d. Plots represent relative fold changes in mRNA expression (mean ± SEM) from two independent experiments. (B) Luciferase reporter assays were performed in A375, UACC257, and BLM cells that were transfected with pGL3 reporter vector containing the TERT promoter region (−340 to −55) with −146C > T or −124C > T mutation. Transfected cells were treated with siRNA-targeting BRAF or ERK2. Data shown are representative of two independent experiments. (C) A375, UACC257, G361, WM793, and Malme-3M cells were treated with BRAF and MEK inhibitors (0.1 µM dabrafenib and 20 nM trametinib), and BLM cells were treated with MEK inhibitor (20 nM trametinib). DMSO control (Ctrl) or BRAF/MEK inhibitor-treated cells were analyzed for telomerase activity after 2 d by a Telomere Repeat Amplification Protocol (TRAP) assay. Data shown are from two experiments and represent relative telomerase activity (mean ± SEM). (D) A375, UACC257, G361, BLM, WM793, and Malme-3M cells were transfected with si-Ctrl or si-BRAF and analyzed for telomerase activity after 3 d. Data from two experiments are shown (mean ± SEM). (E) Colony formation assay was performed in vector or shBRAF-expressing A375 and vector or shERK2 BLM cells. TERT was re-expressed in shBRAF and shERK2 cells via lentiviral transduction of Flag-TERT WT construct, and colony formation assay was performed in parallel. Representative images from two independent experiments are shown. (F) Plot depicts average number of colonies counted per field (mean ± SEM) from all experiments in the earlier assay. Student’s t test (two-tailed) was used for all statistical analyses: *P < 0.05; ***P < 0.001.

