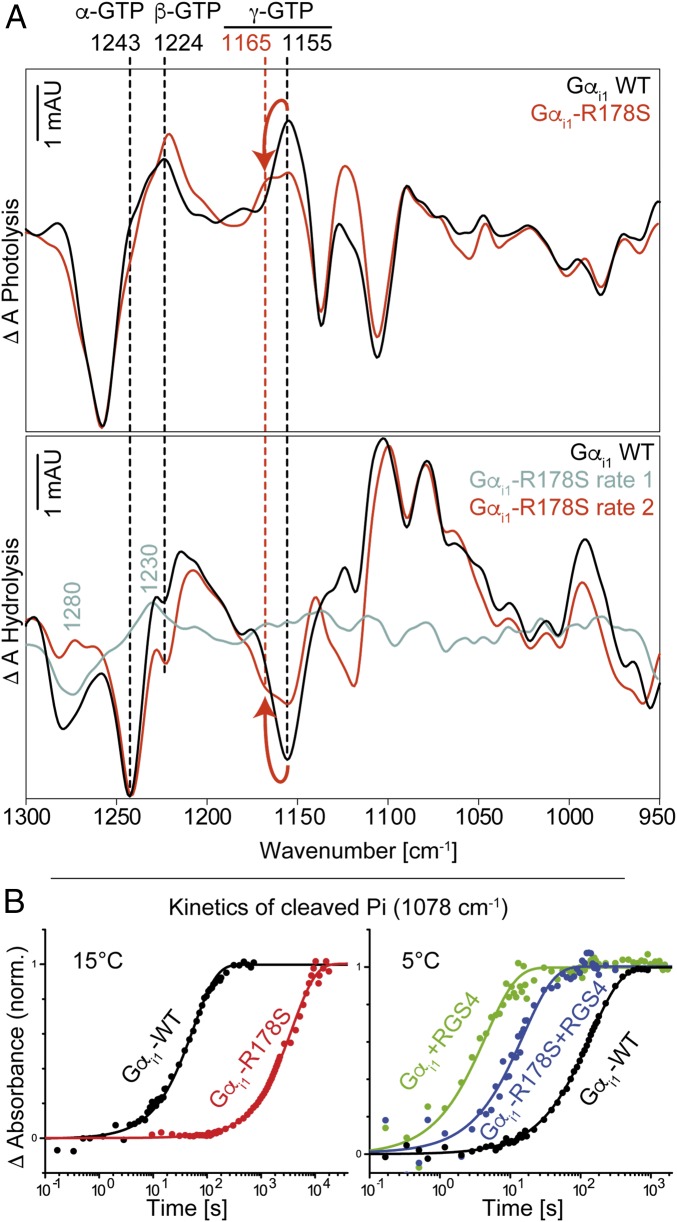
Fig. 2.
(A) Photolysis and hydrolysis FTIR difference spectra (global fit) of Gαi1-WT and the mutant Gαi1-R178S. (B) Kinetics of cleaved phosphate (1,078 cm−1) for Gαi1-WT, Gαi1-R178S, and Gαi1-R178S + RGS4 at 15 °C and 5 °C. In A, positive bands in the photolysis spectra and negative bands in the hydrolysis spectra correspond to the GTP state. Positive bands in the hydrolysis spectra correspond to the GDP state. Arrows indicate the γ-GTP shift caused by the mutation. In B, mutation of Arg178 caused a slowdown of the GTPase reaction by two orders of magnitude. RGS4 addition reversed this effect. Kinetic constants obtained from global fits are depicted in Table 1. mAU, milli absorbance units; norm., normalized.

