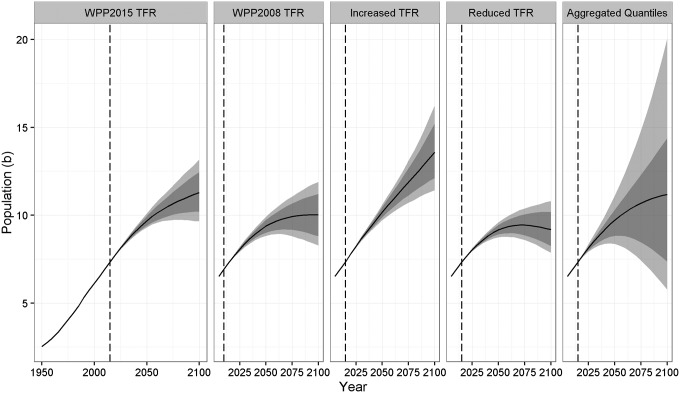
Fig. 4.
Sensitivity analysis, global level. From left to right the panels show the following projections: the UN 2015 assessment as published by the UN; the UN model as applied to baseline data in the UN 2008 assessment; the UN model applied to a 10% higher baseline TFR in selected countries; the 10% lower baseline TFR; and the UN 2015 model assuming perfect correlation.

