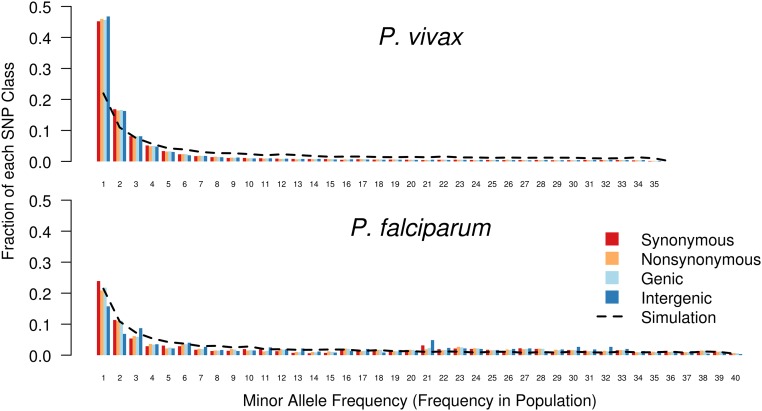
Fig. 3.
Allele-frequency spectra suggest greater population expansion among P. vivax than among P. falciparum. Each column indicates the fraction of the total SNPs that fall into a particular frequency class. Columns are color coded by type of SNP. The x axis represents the number of samples within which each SNP occurs. (Upper) We observed a preponderance of low-frequency alleles in the P. vivax population, compared with coalescent simulations of a no-growth population (black line). Under a Wright–Fisher model of genetic evolution, these data suggest that the P. vivax population has undergone a recent expansion. (Lower) In contrast, for P. falciparum, we observed an excess in intermediate-frequency minor alleles, reflecting the subdivided population structure.

