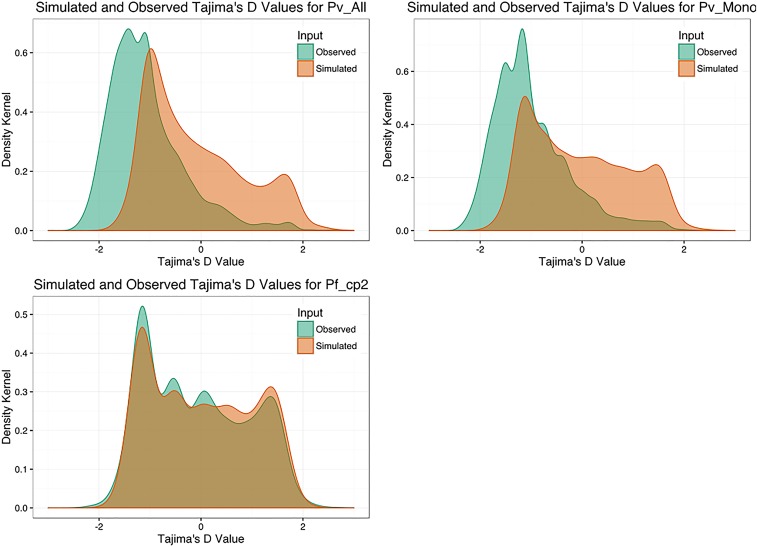
Fig. S5.
Observed and simulated distributions of population summary statistics. Observed (orange) and simulated (green) Tajima’s D values for the ancestral P. falciparum population (Pf_cp2), the monoclonal P. vivax clinical isolates (Pv_Mono), and all P. vivax isolates (Pv_All). Modeling parameters were inferred from one-model best-fit demographic scenarios.

