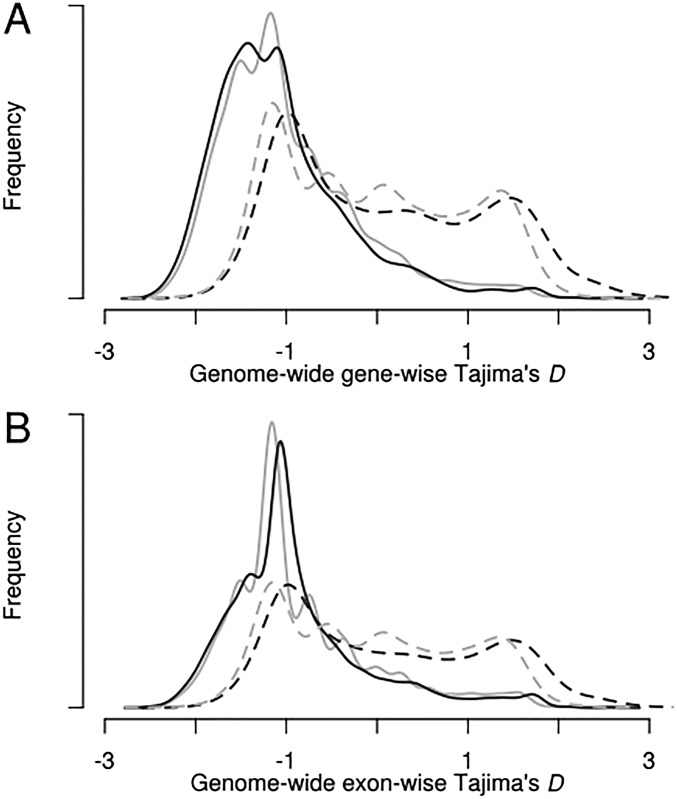
Fig. S6.
Observed genewise and exonwise Tajima’s D distributions for P. vivax and P. falciparum. (A) Whole-genome genewise Tajima’s D was calculated for the entire P. vivax isolate set (n = 70; solid gray line), the monoclonal P. vivax isolates (n = 28; solid black line), the entire P. falciparum isolate set (n = 80; dashed black line), and the ancestral P. falciparum subpopulation (n = 18; dashed gray line). Distributions of whole and subset datasets for both species show close correlation, providing evidence that subsetting these genetic data does not bias allele frequencies. (B) Distributions of exonwise Tajima’s D demonstrate characteristics similar to the genewise analysis.

