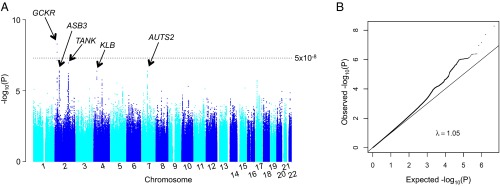
Fig. 1.
Genome-wide association results of log grams per day alcohol in the Alcohol Genome-Wide Association (AlcGen) and Cohorts for Heart and Aging Research in Genomic Epidemiology Plus (CHARGE+) Consortia. (A) Manhattan plot showing the significance of the association (−log10-transformed P value on the y axis) for each SNP at the chromosomal position shown on the x axis. The dotted line represents the genome-wide significance level at P = 5 × 10⁻⁸. The genes that were followed up are labeled. (B) Quantile–quantile plot comparing the expected P value on the x axis and the observed P value on the y axis (both were −log10 transformed).

