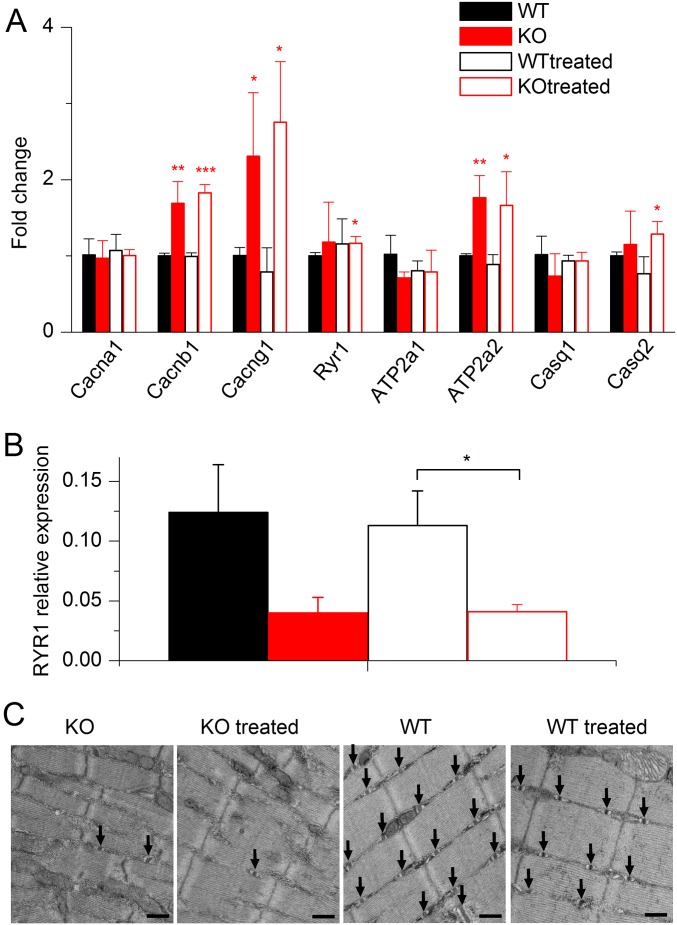
Fig. S7.
Absence of changes in the expression of genes of the EC coupling machinery and in muscle fiber structure after 3 wk of wortmannin treatment. (A) Relative fold changes in mRNA level between tibialis muscles from WT, WT treated, KO, and KO treated animals for DHPR α1, β1, and γ1 subunits (Cacna1s, Cacnb1, and Cacng1); type 1 ryanodine receptor (Ryr1); type 1 and 2 SERCA pumps (Atp2a1 and Atp2a2); and calsequestrin 1 and 2 (Casq1 and Casq2). Data are mean ± SD. All fold changes were calculated versus the value of the WT group. *P < 0.05; **P < 0.01; ***P < 0.001 with unpaired t test. The major changes in the diseased muscles corresponded to an increased level of DHPR β1 and γ1 subunits and in SERCA2. These changes persisted in muscles from the treated KO animals, whereas no other substantial modification was detected in muscles from both treated WT and KO animals. (B) Immunoblot analysis showing no change in the protein level of RYR1 between treated and untreated KO muscles (n = 5 in each group). GAPDH was used as the internal control. Data are expressed as mean ± SEM. *P < 0.05 with unpaired t test. (C) Ultrastructure evaluation of muscles from wortmannin-treated and untreated animals. Electron microscopy performed on longitudinal sections of skeletal muscle reveals approximately appropriate myofibrillar and mitochondrial morphology, with variable numbers of triad structures (arrows) in the intermyofibrillar space. Images shown are at 30,000× magnification. (Scale bar, 500 nm.) Upon visual inspection, the MTM and WT specimens were easily distinguishable from one another due to the presence of sarcotubular disorganization and differences in myofibril thickness and organization. A distinction between wortmannin-treated and untreated states within each genotype was not possible, and this was supported by our quantitation of t-tubules, l-tubules, and triads (Table S2).

