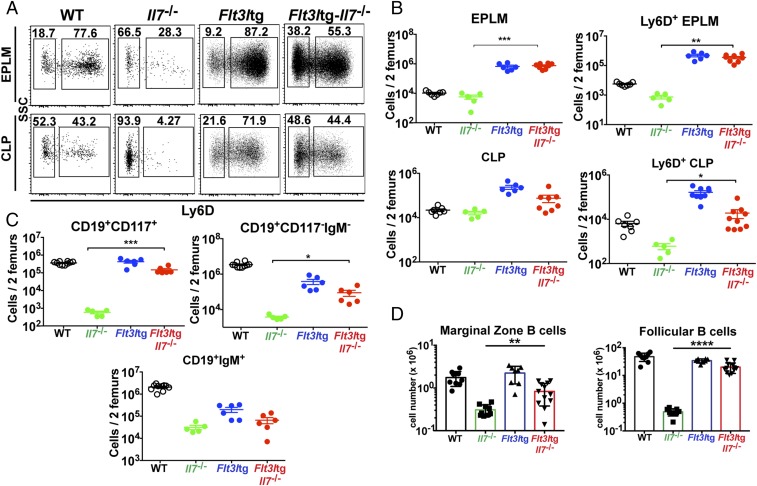
Fig. 2.
Increased in vivo FL levels rescue B-cell generation in Il7−/− mice. (A) Representative FACS plots of EPLM (Upper) and CLP (Lower) from WT, Il7−/−, Flt3ltg, and Flt3ltg-Il7−/− mice. (B) Numbers of EPLM (Upper Left), CLP (Lower Left), Ly6D+ EPLM (Upper Right), and Ly6D+ CLP (Lower Right) from the mouse genotypes indicated on the x axes. For each mouse genotype, mean ± SEM is shown. (C) Numbers of CD19+CD117+ (Upper Left), CD19+CD117−IgM− (Upper Right), and CD19+IgM+ (Lower) bone marrow cells from the mice indicated on the x axes. For each mouse genotype, mean ± SEM is shown. (D) Numbers of CD19+CD21highCD23low marginal zone (Left) and CD19+CD21+CD23+ follicular (Right) B cells in the spleens of WT or mutant mice, as indicated on the x axes. For each mouse genotype, mean ± SD is shown. *P ≤ 0.05, **P ≤ 0.01, ***P ≤ 0.001, ****P ≤ 0.0001.

