Fig. 4.
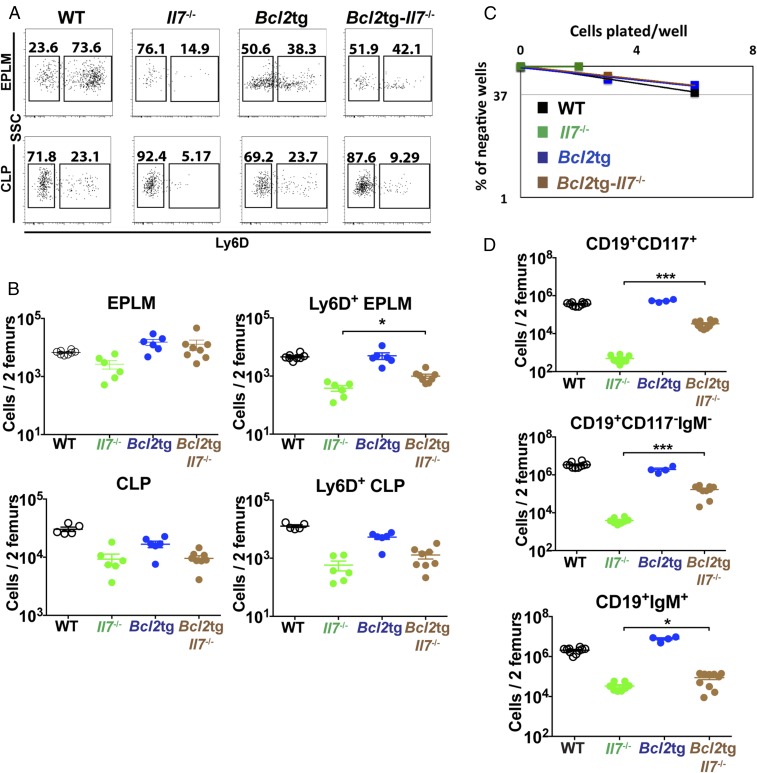
Bcl2 overexpression partially rescues B-cell commitment in Il7−/− mice. (A) Representative FACS plots of EPLM (Upper) and CLP (Lower) from WT, Il7−/−, Bcl2tg, and Bcl2tg-Il7−/− mice. (B) Numbers of EPLM (Upper Left), CLP (Lower Left), Ly6D+ EPLM (Upper Right), and Ly6D+ CLP (Lower Right) from WT and mutant mice, as indicated on the x axes. For each mouse genotype, mean ± SEM is shown. (C) In vitro limiting dilution analysis of Ly6D+ EPLM B-cell potential. Ly6D+ EPLM were sorted from WT, Il7−/−, Bcl2tg, and Bcl2tg-Il7−/− mice and plated at the indicated concentrations on OP9 stromal cells together with IL-7. One representative of three independent experiments is shown. (D) Numbers of CD19+CD117+ (Top), CD19+CD117−IgM− (Middle), and CD19+IgM+ (Bottom) bone marrow cells from WT and mutant mice, as indicated on the x axes. For each mouse genotype, mean ± SEM is shown. *P ≤ 0.05, ***P ≤ 0.001.

