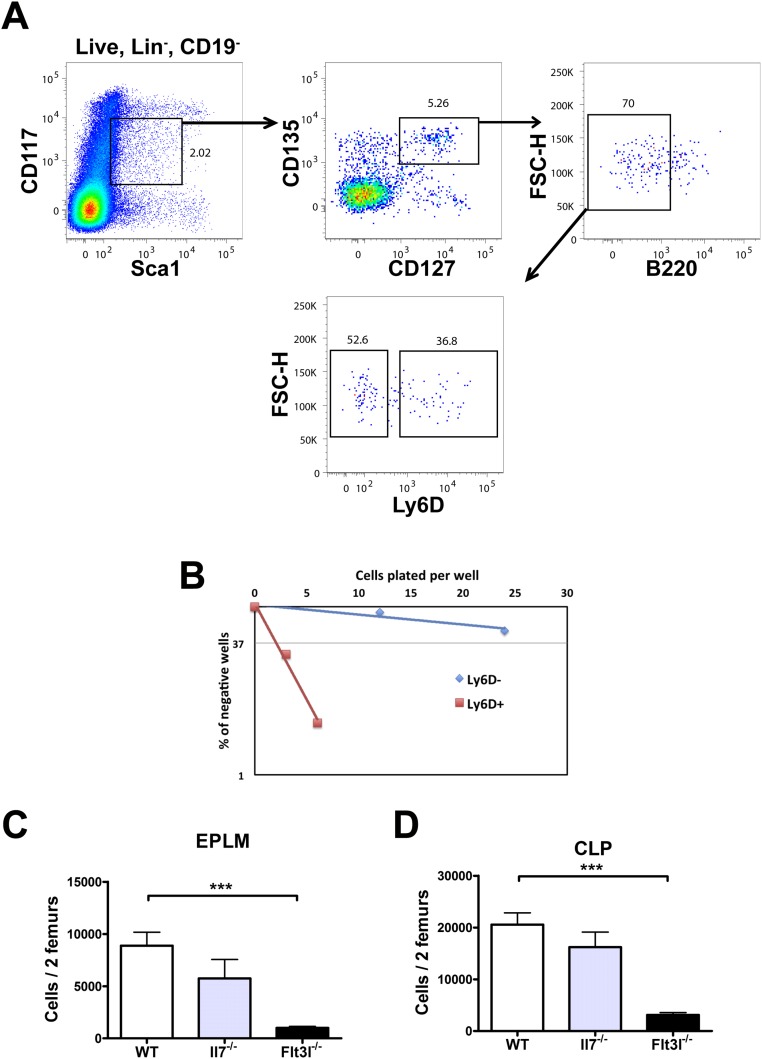
Fig. S1.
(A) CLP FACS staining in WT mice. FACS plots showing the gating strategy used for the identification of Ly6D+ CLP. Lineage staining was as follows: SiglecH, CD115, CD11c, NK1.1, Gr-1. (B) In vitro limiting dilution analysis of Ly6D+ and Ly6D− EPLM B-cell potential. Cells were sorted as shown in Fig. 1A and plated at the indicated concentrations on OP9 stromal cells together with IL-7. A representative of three independent experiments is shown. (C and D) Numbers of EPLM (C) and CLP (D) progenitors in WT (n = 13), Il7−/− (n = 5), and Flt3l−/− (n = 10) mice. EPLM were stained as shown in Fig. 1A and CLP as shown in A. Student’s t test. ***P ≤ 0.001. Bars show mean ± SEM.

