Fig. S6.
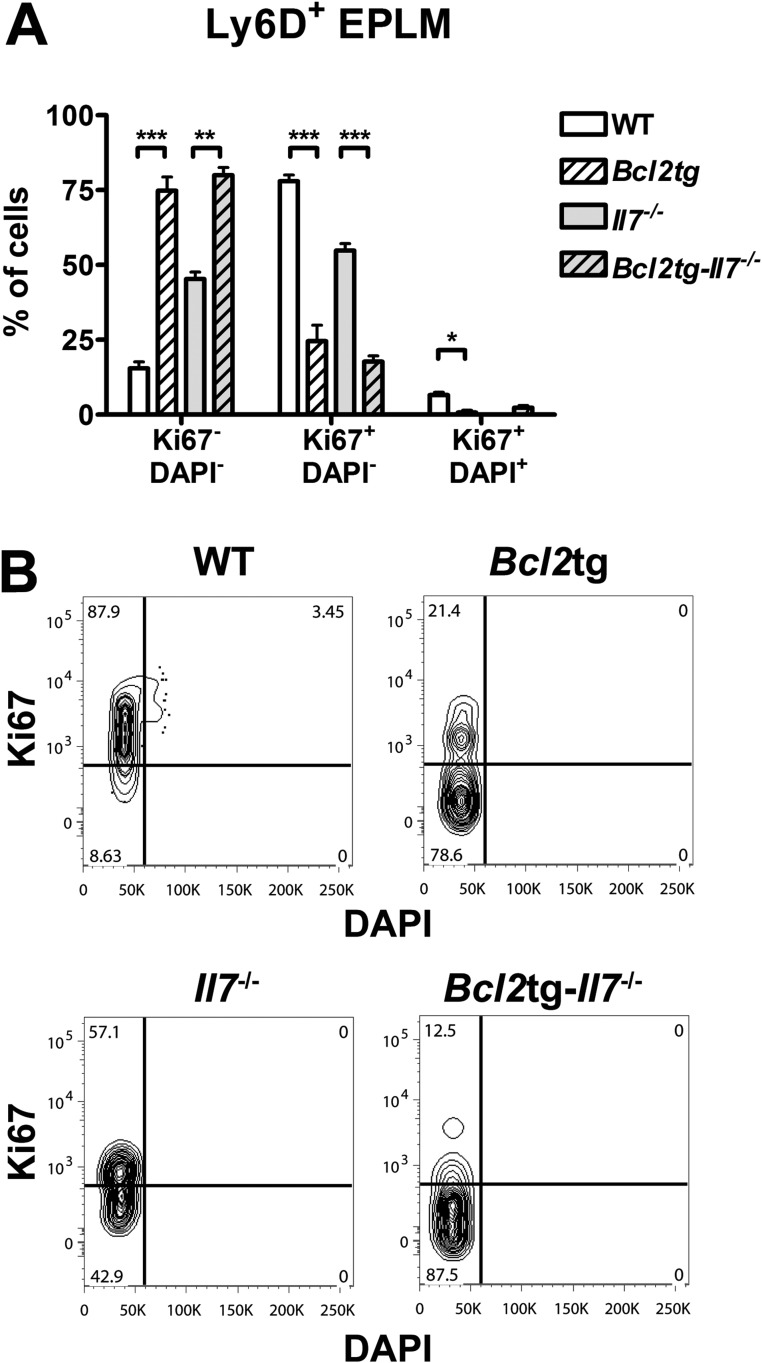
Quiescent state of Bcl2-rescued cells in vivo. (A) Cell cycle analysis of Ly6D+ EPLM from WT (n = 5), Bcl2tg (n = 2), Il7−/− (n = 2), and Bcl2tg-Il7−/− (n = 4) mice. Graph shows percentages of Ki67−DAPI−, Ki67+DAPI−, and Ki67+DAPI+ Ly6D+ EPLM. *P ≤ 0.05, **P ≤ 0.01, ***P ≤ 0.001. Student’s t test. Bars show mean ± SEM. (B) Representative Ki67/DAPI FACS plots of the Ly6D+ EPLM cell cycle analysis collectively presented in A.

