Fig. 1.
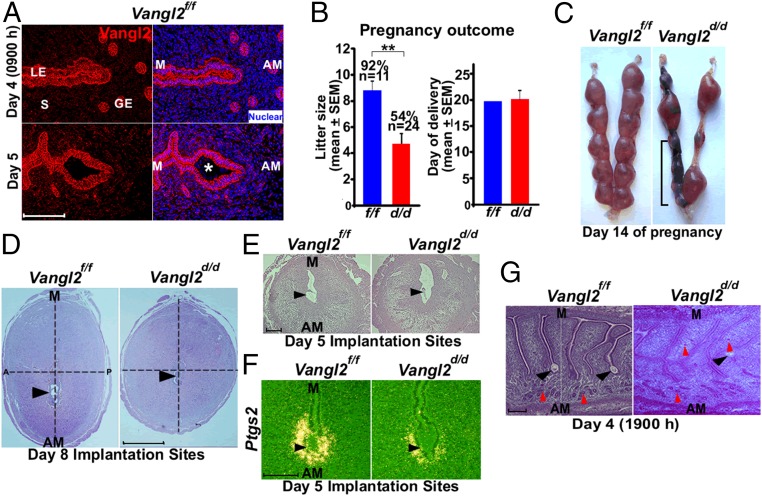
Uterine inactivation of Vangl2 results in compromised pregnancy outcome. (A) IF localization of Vangl2 in uteri on days 4 and 5 of pregnancy. GE, glandular epithelium; LE, luminal epithelium; S, stroma; *, embryo. (Scale bar, 100 µm.) (B) Litter sizes and day of delivery in littermate Vangl2f/f and Vangl2d/d females. Percentages and numbers above the bars indicate the number of litters born compared with the total number (n) of plug-positive females in each genotype. Data are shown as mean ± SEM; **P < 0.01. (C) Day 14 implantation sites in Vangl2f/f and Vangl2d/d females. The bracket indicates adjacent resorption sites. (D) Histology of day 8 implantation sites in Vangl2f/f and Vangl2d/d mice. Note the elliptical vs. round shape of Vangl2f/f and Vangl2d/d implantation sites, respectively. (Scale bar, 1 mm.) A, anterior; P, posterior. (E) Histology of day 5 implantation sites in Vangl2f/f and Vangl2d/d mice. (Scale bar, 200 µm.) (F) In situ hybridization of Ptgs2 in Vangl2f/f and Vangl2d/d implantation sites on day 5. (Scale bar, 100 µm.) (G) Histology of longitudinal sections of Vangl2f/f and Vangl2d/d uteri on the evening of day 4. The vertical line separates serial sections showing separate crypts from the same uterine piece. Black arrowheads indicate the location of embryos. Red arrowheads indicate glands. (Scale bar, 200 µm.)

