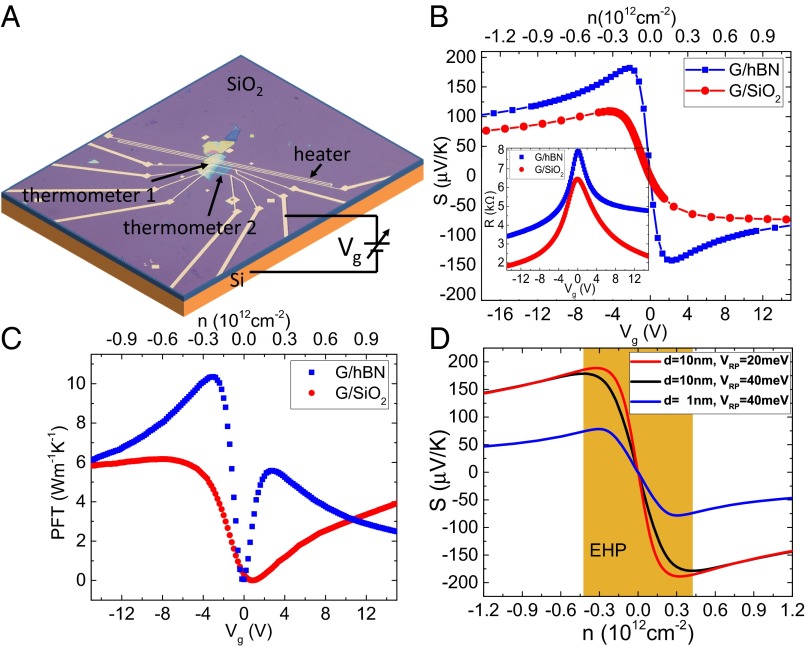
Fig. 1.
Thermoelectric measurement of graphene at room temperature. (A) Optical micrograph of the graphene on hBN (G/hBN) device. (B) Measured Seebeck coefficient in G/hBN and G/SiO2 devices as a function of back gate at 290 K. (Inset) Measured resistance vs. Vg in both devices at 290 K. (C) Measured PFT in both samples as a function of back gate at 290 K. (D) Simulation of carrier density dependence of the Seebeck coefficient at 300 K using the screened Coulomb-scattering model for two values of the hBN thickness, d, and random potential fluctuations, VRP, induced by charge impurities (Supporting Information). The rectangular shadow corresponds to the EHP region in a sample with d = 10 nm and VRP = 40 meV.

