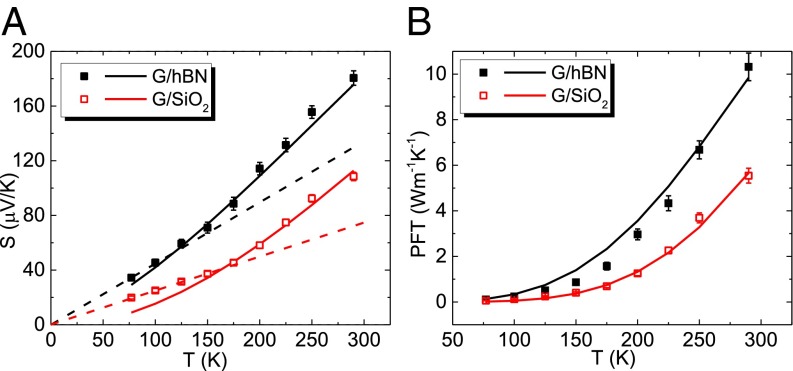
Fig. 3.
Temperature dependence of the Seebeck coefficient and PFT at fixed carrier density. (A) Measured Seebeck coefficient in G/hBN (, solid squares) and G/SiO2 (, open squares) devices are plotted together with the theoretical values (solid lines) calculated by using the screened Coulomb-scattering model discussed in the text. Dashed lines serve as guides to emphasize the nonlinear behavior. (B) Measured PFT (same density as in A; solid and open squares) from both devices are compared with theoretical values (solid lines).

