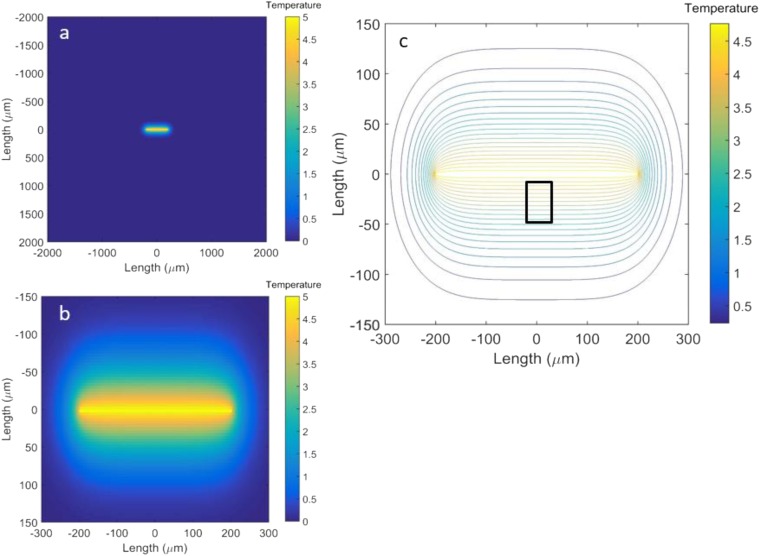
Fig. S2.
Simulation of temperature distribution. (A) Temperature distribution in the device (4,000 μm × 4,000 μm). (B) Zoom-in view of A. The temperature of the 400-μm heater in the center is assumed to be uniform. (C) Isotherms in the vicinity of the heater. The rectangular box, 40 μm × 40 μm, indicates the area in which the thermometers and graphene channel are located.

