Fig. 7.
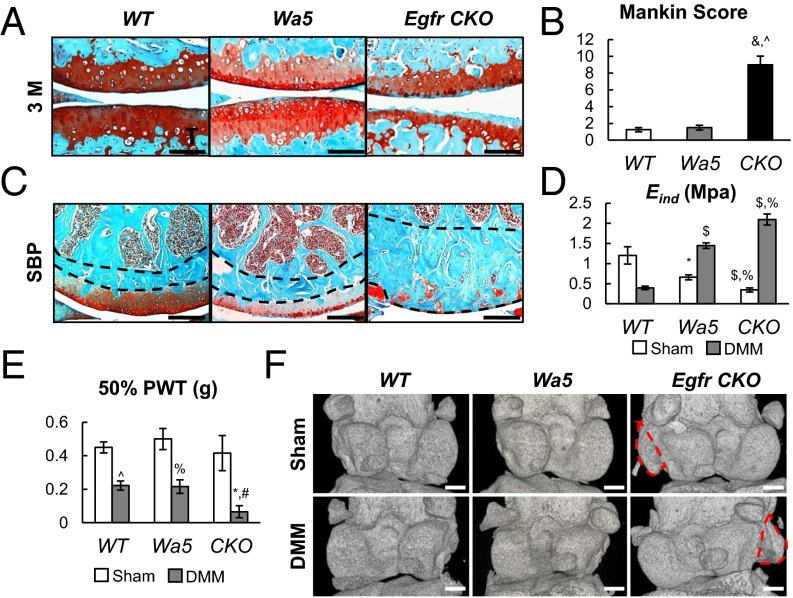
Egfr CKO mice develop late OA symptoms after DMM surgery. (A) Safranin O staining of WT, Wa5, and CKO mouse joints at the lateral site at 3 mo postsurgery. (Scale bars, 100 μm.) (B) OA severity of the lateral site was measured by Mankin score. n = 5 per genotype. &P < 0.001 vs. WT; ^P < 0.001 vs. Wa5. (C) Egfr CKO mice had thickened subchondral bone plates at the medial site at 2 mo after DMM surgery. Lines depict the area of the subchondral bone plate. (Scale bars, 100 μm.) (D) Both sham and DMM femurs were harvested at 2 mo postsurgery for nanoindentation to measure cartilage surface modulus. n = 6 per genotype. *P < 0.05, $P < 0.01 vs. WT; %P < 0.01 vs. Wa5. (E) von Frey assay was performed at 1 mo postsurgery. n = 8 per genotype. *P < 0.05 vs. WT; #P < 0.05, %P < 0.01, ^P < 0.001 vs. sham. (F) 3D microCT images show osteophytes were only found in Egfr CKO joints. Red circles indicate osteophytes. (Scale bars, 500 μm.)

