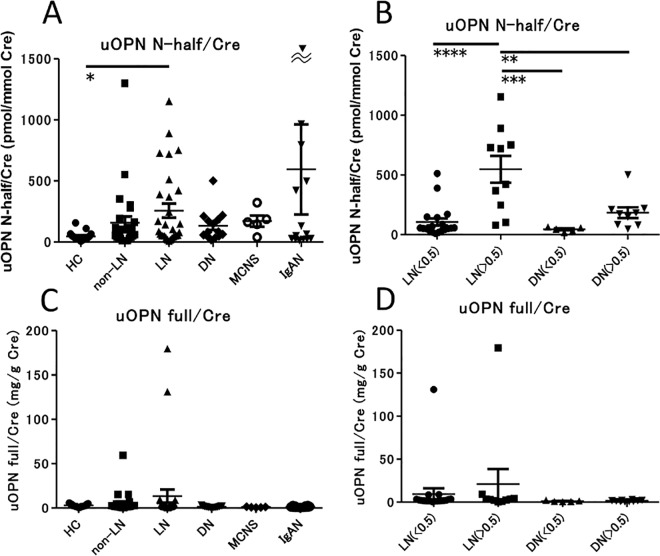
Fig 1. Comparison of the concentration of urine OPN full and N-half in SLE and several renal diseases.
Concentration of urine OPN N-half (A) and urine OPN full (C) in healthy controls (N = 17) and patients with SLE without nephropathy (N = 27), LN (N = 29), DN (N = 14), MCNS (N = 5) and IgAN (N = 14). Values were corrected by calculating the ratio to urine creatinine (Cre) concentration. * p < 0.05 by Dunn’s test. Concentration of urine OPN N-half (B) and urine OPN full (D) in patients with LN and DN, separated into subgroups with minimal (P/C ratio < 0.5) or overt (P/C ratio > 0.5) proteinuria. Values are corrected by urine Cre level. ** p < 0.01, *** p < 0.001, **** p < 0.0001 by ANOVA corrected by the Bonferroni method.

