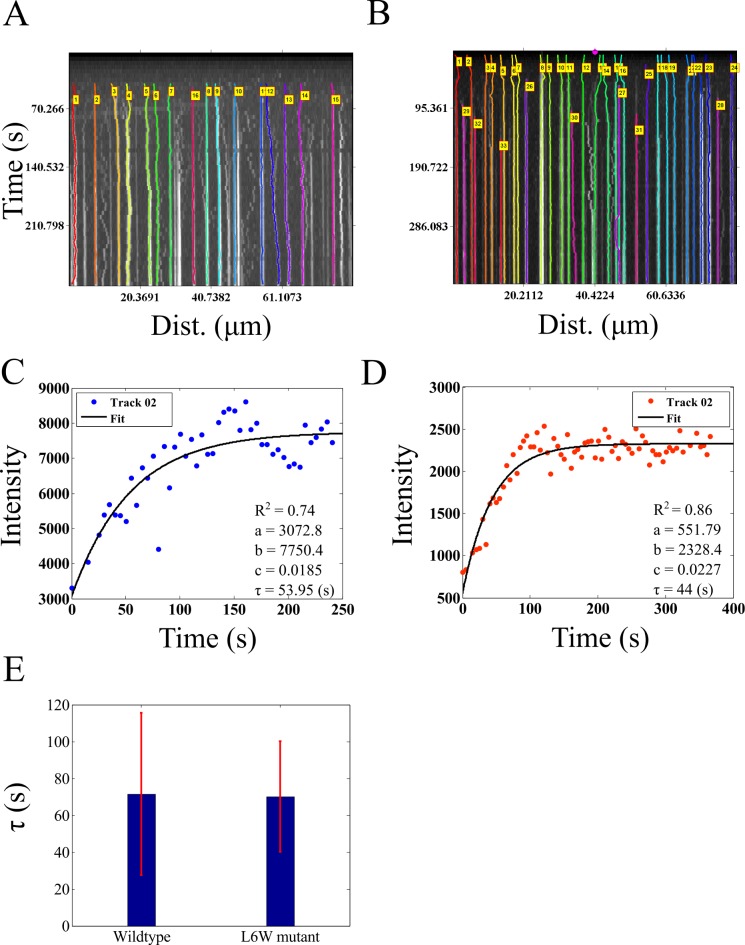
Fig 7. Dynamics of clathrin assembly.
(A, B) Microscopy time-series taken from Holkar et al. [24] of fluorescently labeled clathrin assembly in the presence of (A) wild-type and (B) mutant epsin were analyzed using AMTraK. Colored lines in the kymographs indicate detected tracks. (C, D) The change in intensity as a function of time based on AMTraK detected tracks from (C) clathrin + w.t. epsin and (D) compared to clathrin + (L6W) mutant epsin. The intensity kinetics plots are fit to a single-phase exponential function, y = a+(b-a)*(1-e-c*t) to obtain the time constant of assembly τ = 1/c (red). R2: goodness of fit. (D) The mean values (error bar represents s.d.) of the time constant of assembly of clathrin (τ) in the presence of wild-type and mutant epsin are compared.

