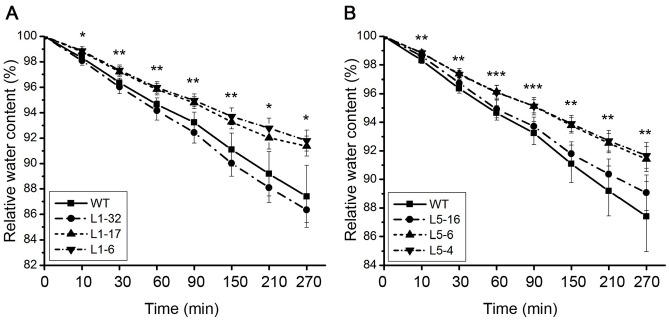
Fig 6. Water content of detached leaves from wild type and transgenic lines.
(A) Comparison of the relative water content of leaves of wild type (WT) and transgenic PtPYRL1 seedlings (L1-32, L1-17, and L1-6) at different time point after detached. Error bars indicate SD (n = 4). (B) Comparison of the rate of water loss of leaves of wild type (WT) and transgenic PtPYRL5 seedlings (L5-16, L5-6, and L5-4) at different time point after detached. Error bars indicate SD (n = 4). Significant differences are indicated as *P < 0.05, **P < 0.01 and ***P < 0.001 (ANOVA test), respectively.

