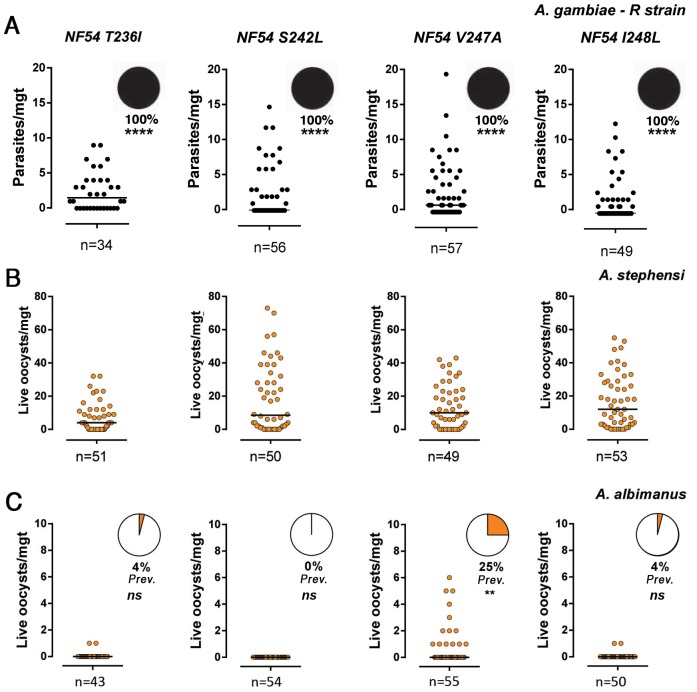
Fig 3. Infection phenotype of different Pfs47 complement P. falciparum lines (T236I, S242L, V247A and I248L) in the A. gambiae R strain, A. albimanus and A. stephensi 7–9 d post-feeding representing two pooled independent experiments (Experiment 1 and Experiment 2, S1–S3 Tables).
(A) Infection of A. gambiae R strain. The pie charts indicate the proportion of live (orange) and melanized (black) parasites. (B) Infection of A. stephensi Nijmegen, and (C) A. albimanus mosquitoes with P. falciparum NF54 Pfs47KO complemented derivatives expressing Pfs47 haplotypes NF54 T236I, S242L, V247A and I248L. The orange area of the pie charts indicates the prevalence of infection in A. albimanus. Each dot represents the number of parasite on an individual mosquito and the median is indicated with a black line (n = number of midguts examined). Melanization prevalences in A. gambiae R strain were compared with the X2 test relative to Pfs47 KO + NF54, infection prevalences in A. albimanus were compared with the X2 test, ns = no significant difference,** p<0.01, **** p<0.0001. All parasite phenotypes were confirmed in two or three independent experiments.

