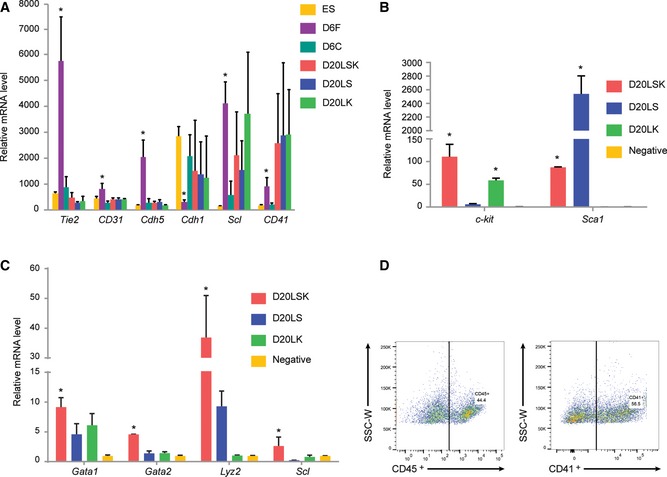
Figure 2. Confirmation of the identity of the sorted cell populations.

- mRNA analysis of expression of endothelial (Tie2, CD31, Cdh5), epithelial (Cdh1), and early hematopoietic (Scl, CD41) marker genes in the indicated sorted cell populations. Error bars represent standard deviation (SD), n = 3. Student's t‐test. *P < 0.05.
- Confirmation of the purity of sorted populations by qRT–PCR: c‐Kit is highly expressed only in the c‐Kit+ (D20LSK and D20LK) populations, and Sca1 is highly expressed only in the in Sca1+ (D20LSK and D20LS) populations. Error bars represent standard deviation (SD), n = 3. Student's t‐test. *P < 0.05.
- qRT–PCR analysis of Gata1, Gata2, Lyz2, and Scl expression in the sorted cell populations on day 20. Error bars represent standard deviation (SD), n = 3. Student's t‐test. *P < 0.05.
- FACS analysis of ESC‐derived cells confirming that D20LS, D20LK, and D20LSK cell populations express the early hematopoietic marker CD41 and the pan‐hematopoietic marker CD45.
