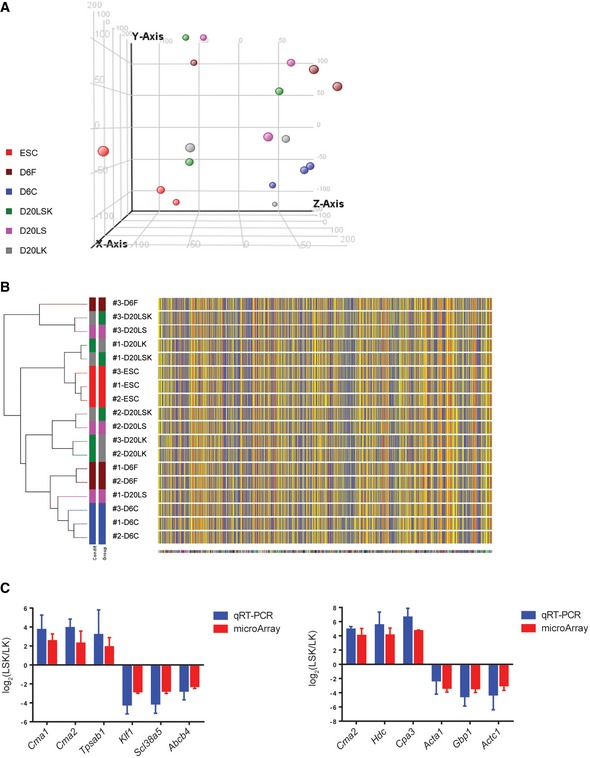
Figure EV2. Gene expression analysis and validation.

- PCA of mRNA microarray data.
- Clustering analysis of mRNA expression array data.
- qRT–PCR validation of several shRNA target genes with most increased or decreased expression in the LSK population compared with the LS and LK populations. Error bars represent standard deviation (SD), n=3. Student's t‐test shows no significance between the microarray and qRT‐PCR data.
