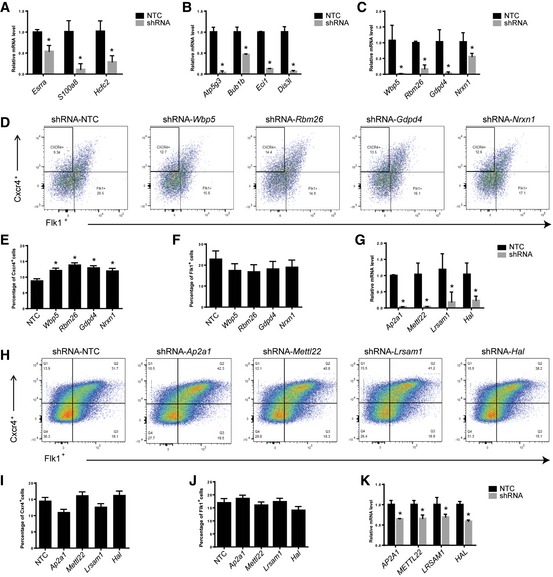
qRT–PCR analysis showing the knockdown of Group XII genes Esrra, S100a8, and Hcfc2 in mESCs. Error bars represent standard deviation (SD) of technical triplicates. Student's t‐test, *P < 0.05.
qRT–PCR analysis showing the knockdown of Group XI genes Atp5g3, Bub1b, Eci1, and Dis3l in mESCs. Error bars represent standard deviation (SD) of technical triplicates. Student's t‐test, *P < 0.05.
qRT–PCR analysis showing the knockdown of Group IV genes Wbp5, Rbm26, Gdpd4, and Nrxn1 in mESCs. Error bars represent standard deviation (SD) of technical triplicates. Student's t‐test, *P < 0.05.
Flow cytometric analysis of endoderm and mesoderm/endothelium cells in EBs on day 6 with knockdown of Wbp5, Rbm26, Gdpd4, and Nrxn1, respectively.
Percentage of CXCR4+ cells in EBs on day 6 with knockdown of Wbp5, Rbm26, Gdpd4, and Nrxn1. Error bars represent standard deviation (SD), n = 2. Student's t‐test, *P < 0.05.
Percentage of Flk1+ cells in EBs on day 6 with knockdown of Wbp5, Rbm26, Gdpd4, and Nrxn1. Error bars represent standard deviation (SD), n = 2. Student's t‐test shows no significance.
qRT–PCR analysis showing the knockdown of Group X genes Ap2a1, Mettl22, Lrsam1, and Hal in mESCs. Error bars represent standard deviation (SD) of technical triplicates. Student's t‐test, *P < 0.05.
Flow cytometric analysis of endoderm and mesoderm/endothelium cells in EBs on day 6 with knockdown of Ap2a1, Mettl22, Lrsam1, and Hal.
Percentage of CXCR4+ cells in EBs on day 6 with knockdown of Ap2a1, Mettl22, Lrsam1, and Hal. Error bars represent standard deviation (SD), n = 3. Student's t‐test shows no significance.
Percentage of Flk1+ cells at day 6 with knockdown of Ap2a1, Mettl22, Lrsam1, and Hal. Error bars represent standard deviation (SD), n = 3. Student's t‐test shows no significance.
qRT–PCR analysis showing the knockdown AP2A1, METTL22, LRSAM1, and HAL in human CD34+ cells. Error bars represent standard deviation (SD) of technical triplicates. Student's t‐test, *P < 0.05.

