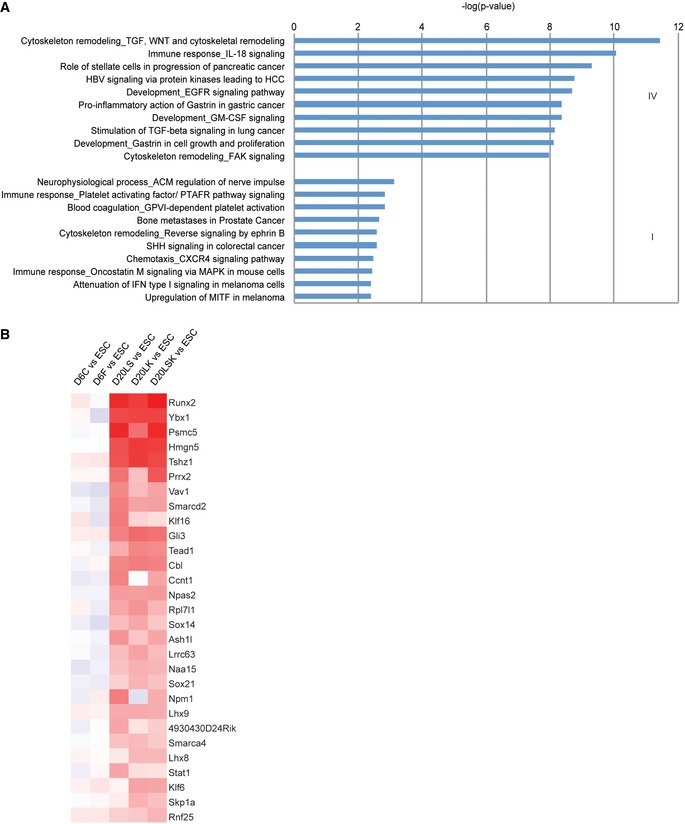
Figure EV4. GO analysis (Groups IV and I genes) and heat map of Group I genes.

- GO analysis of Groups IV (upper) and I (lower) target genes showing the pathways enriched during the endothelial–hematopoietic transition.
- Transcription factors enriched in Group I genes are related to cardiomyocyte development.
