-
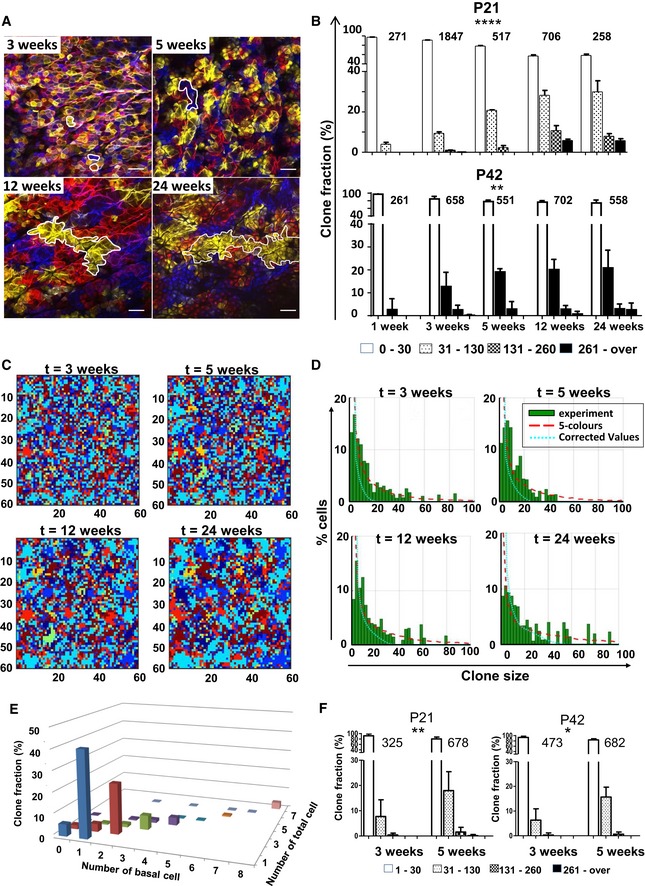
A
Photomicrographs represent 2D optical sections from a Z‐stack acquisition of whole‐mounted skin displaying IFE harbouring multiple clones of different colours at 3, 5, 12 and 24 weeks (scale bar represents 50 μm). In each image, a clone is circled in white, illustrating the progression of clone size at different times.
-
B
Histogram charts showing the relative frequency of clones according to their size between 3 and 24 weeks in mice induced at P21 and P42. The frequency of larger clones increases over time. Chi‐square test, ****P < 0.0001 for P21 group and **P = 0.0056 for P42 group. The number of clones evaluated at each time point is indicated above each histogram series.
-
C, D
Correction for contiguous clones harbouring a same colour. (C) Snapshots from a computer simulation on a 2D lattice attributing six colours to basal keratinocytes. The figure illustrates the typical evolution of clone clusters in a 2D lattice simulating the basal layer with six different colours at different time points. The real clone size is simulated by attributing an infinite number of colours to the lattice and ensuring that each basal cell is uniquely labelled. (D) Plots show the probability for an individual keratinocyte to belong to a clone of a given size. Experimental data are represented in green bars. Red curve represents the five‐colour simulation and the blue curve the real size simulation. Although the frequency of large clones is overestimated in experimental data due to the limited five‐colour palette, it is apparent that real clone size progresses over time.
-
E
Histogram charts showing the distribution of clones at D1‐3 following tamoxifen induction according to total number of cells and number of basal cells.
-
F
Histogram charts showing the relative frequency of clones according to their size between 3 and 5 weeks in groups injected at P21 and P42 with a single low dose of tamoxifen to perform a low‐density staining. The frequency of larger clones increases over time. Chi‐square test, **P = 0.0013 for P21 group and *P = 0.0296 for P42 group.
Data information: All data are represented as mean ± s.e.m.