
Figure EV1. Scoring and sample analysis.
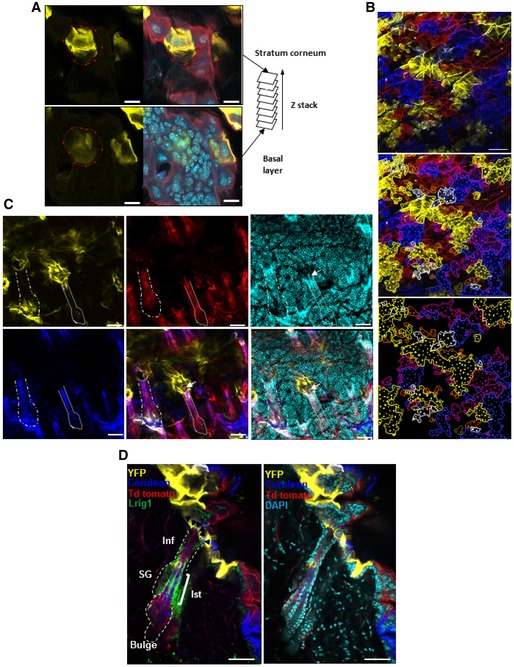
Surface corneocytes are in relation with underlying basal epidermal cells.
- Photomicrograph represents a 2D optical section from a Z‐stack acquisition of whole‐mounted skin displaying the stratum corneum (top images) and basal epidermal layer (bottom images). The red circle delimits a yellow clone sharing corneocytes and basal epidermal cells (scale bar represents 20 μm).
- Using individual sections from Z‐stacks, limits of clones (lines) were identified and cells (dots) within each clone were counted (scale bar represents 100 μm).
- 2D compiled images from Z‐stack acquisition of whole‐mounted skin. The white arrow shows a yellow clone in contact with a hair follicle shaft. This clone is considered attached to a hair follicle (scale bars represent 50 μm). Contact between IFE clones and HF.
- Photomicrographs represent 2D optical sections from a Z‐stack acquisition of a 0.5‐mm skin section displaying IFE and HF harbouring multiple clones of different colours at 12 weeks. The permanent portion of the hair follicle (isthmus and infundibulum) is labelled with Lrig1 (green). The yellow clone in the IFE immediately adjacent to the HF is considered as attached to the HF. Black arrows show the contact between the yellow clone and the HF. B, bulge; Inf, infundibulum; Ist, isthmus; SG, sebaceous gland; IFE, interfollicular epidermis (scale bar represents 50 μm).