
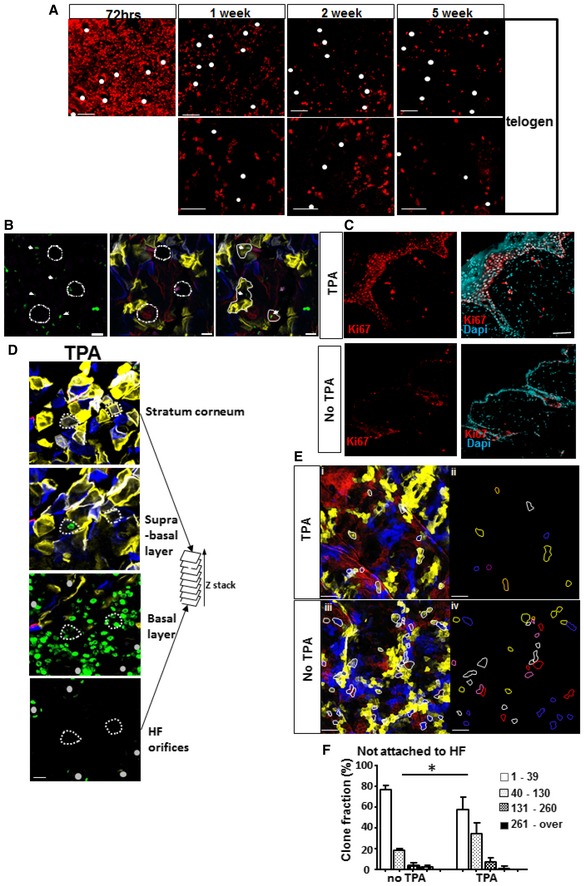
Figure 5. Small clones not attached to hair follicles harbour epidermal populations that are quiescent and can be mobilized upon stimulation.
-
A, BSkinbow mice were induced for five consecutive days and pulsed with BrdU for three consecutive days with two injections per day. Skin was collected either immediately after the last BrdU injection at 72 h or after periods of 1–5 weeks of chase. (A) Photomicrographs show optical sections from a confocal image stack acquired on a whole‐mounted skin preparation immunostained with anti‐BrdU antibody (red). White dots represent hair follicles at different chase time points. (B) At 5 weeks of chase, BrdU staining (green) in skinbow skin revealed single cells distant from hair follicles. White dashed circles: hair follicles. White line: small clones. White arrows: BrdU+ cells (scale bar represents 20 μm).
-
C, DIn Skinbow mice induced at P42–P46, TPA was applied for 1 day, 3 weeks post‐induction, and animals were sacrificed at 48 h following a short pulse of BrdU (2 h). (C) Photomicrographs show optical sections from a confocal image stack acquired on a 0.5‐mm back skin section immunostained with anti‐Ki67 antibody. Ki67+ cells are labelled with Alexa 647 (red). Back skin from treated and untreated areas was collected 48 h after TPA topical application (scale bar represents 20 μm). (D) Multiple optical sections from a Z‐stack acquisition of whole mount preparation of skin treated with TPA and stained with anti‐BrdU (green). Small clones not attached to HF (two examples figured by dashed lines) can be tracked from the corneocyte layer down to the basement membrane where BrdU staining demonstrates their proliferation (scale bar represents 50 μm).
-
ERepresentative individual sections from Z‐stacks show small clones (lines) identified in back skin treated (i and ii) or not (iii and iv) with TPA (scale bars represent 100 μm).
-
FReduction in small clone frequency in the areas treated with TPA. Histogram chart showing the clone size distribution and relative frequency of small clones not attached to HF in areas treated with TPA and not treated with TPA in the same mouse. Data pooled from three mice represented as median with interquartile range. The number of clones analysed is indicated on the graph. *P = 0.0272. Data are represented as mean ± s.e.m.