
Figure EV5. Sensitivity analysis of the proposed model.
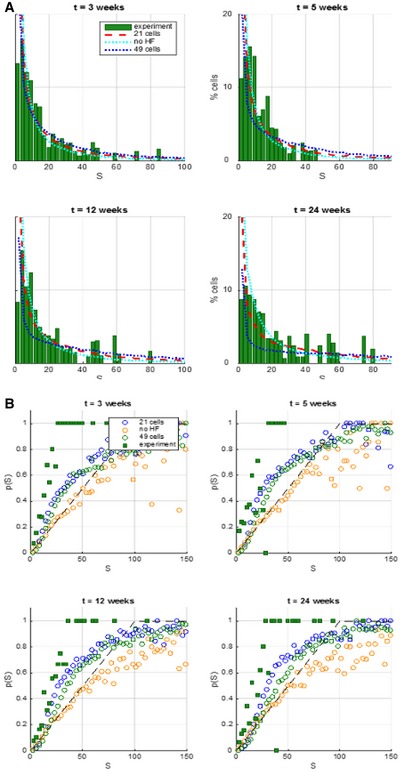
Computer simulation on 2D lattices representing the basal layer and hair follicles. In this analysis, the area of the IFE under the influence of HF cycling is changed from 21 cells (red line) to 49 cells (blue line).
- Plots show the probability for an individual keratinocyte to belong to a clone of a given size. Experimental data are represented in green bars. Theoretical curves take into account the possibility of colour overlap.
- The panels show the probability for a clone to be attached to hair follicles (p(S)) as a function of its size (S). At each time point, three sets of data were figured: values detected experimentally (green squares) versus values produced by simulating the Klein model (orange circles) and values obtained from simulations of the extended model, including the periodic activation of HFs enhancing the rate of migration of post‐mitotic cells in a circular neighbourhood of 21 cells (blue circles) or 49 cells (green circles) around the active HFs.