
Figure 6. Modelling epidermal homeostasis.
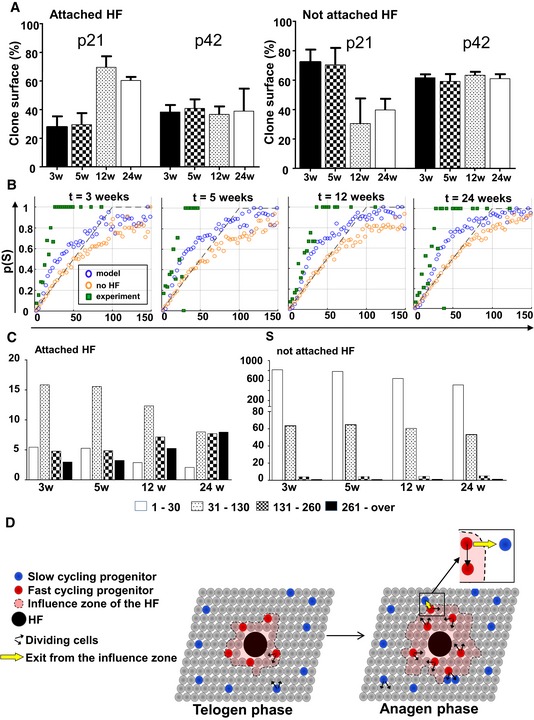
- Bar charts showing the relative surface of clones attached and not attached between 3 and 24 weeks after induction at P21 or P42. Data are represented as mean ± s.e.m.
- Computer simulation on 2D lattices representing the basal layer and hair follicles. The panels show the probability for a clone to be attached to hair follicles (p(S)) as a function of its size (S). At each time point, three sets of data were figured: values detected experimentally (green squares) versus values produced by simulating the Klein model (orange circles), and values obtained from simulations of the extended model, including the periodic activation of HFs (blue circles) enhancing the rate of migration of post‐mitotic cells in a circular neighbourhood of 21 cells around the active HFs. It can be noted that the new model taking into account hair follicles' influence is closer to observed values.
- Clone size distribution using simulations of the extended model taking into account HFs.
- Schematic representation of the model suggested by our findings. Committed progenitors have similar and low proliferation rates around and away from HF during telogen. However, during anagen, proliferation of CPs is increased in a zone of influence around hair follicles. In all cases, CPs divide according to a random fate as proposed by Clayton et al (2007). Upon proliferation of CPs around hair follicles, some CPs exit the zone of influence and remain slow cycling in subsequent anagen phases.