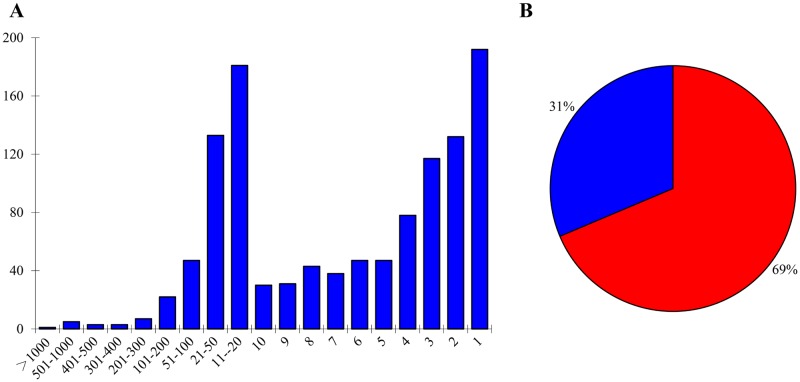
Fig 5. Distribution of identified proteins based on their peptide counts.
A: Protein peptide count numbers vs numbers of proteins. The proteins identified with the same peptide counts were grouped together to obtain the protein numbers. X-axis: protein peptide counts; Y-axis: number of proteins. B: Peptide count percentage distribution of 40 proteins with highest peptide counts (excluding storage proteins) in the chloroplast/amyloplast (red) and other organelles (blue).

