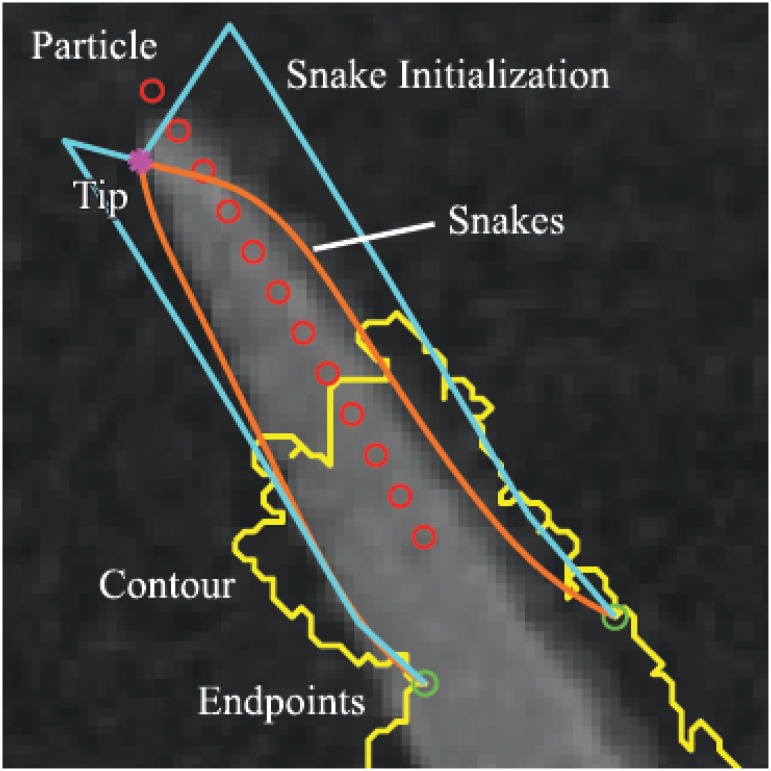
Fig 6. Example of snakes being attracted to leaf edges near a leaf tip.
The yellow curve is the boundary of the initial segmented region; red circles denote the path of particle evolution; green circles denote the anchor points for the snakes initialization; magenta star represents a leaf tip; cyan curves are the initial snake contours; and orange curves are the final, evolved snake contours.

